Reports >
Technology And Media
>
Data Visualization Market Report

Data Visualization Market Report
First published: 24 September 2024 | Last updated: 31 January 2026 | Report Code: data-visualization
Data Visualization Market — USD 15 billion in 2023, Growing to USD 40.27B by 2033 at 10% CAGR
This report provides a comprehensive analysis of the Data Visualization market from 2023 to 2033, outlining key trends, regional insights, competitive landscape, and market forecasts. It aims to equip stakeholders with critical information for informed decision-making.
| Metric | Value |
|---|---|
| Study Period | 2023 - 2033 |
| 2023 Market Size | $15.00 Billion |
| CAGR (2023-2033) | 10% |
| 2033 Market Size | $40.27 Billion |
| Top Companies | Tableau Software, Microsoft Power BI, Qlik, Domo, Sisense |
| Published Date | 24 September 2024 |
| Last Modified Date | 31 January 2026 |

Data Visualization Market Overview
Customize Data Visualization Market Report market research report
- ✔ Get in-depth analysis of Data Visualization market size, growth, and forecasts.
- ✔ Understand Data Visualization's regional dynamics and industry-specific trends.
- ✔ Identify potential applications, end-user demand, and growth segments in Data Visualization
What is the Market Size & CAGR of Data Visualization market in 2023?
Data Visualization Industry Analysis
Data Visualization Market Segmentation and Scope
Tell us your focus area and get a customized research report.
Data Visualization Market Analysis Report by Region
Europe Data Visualization Market Report:
The European Data Visualization market is expected to grow from $3.93 billion in 2023 to $10.56 billion by 2033. The region is experiencing a shift towards data-driven strategies among enterprises, with increasing regulatory emphasis on data governance and analytics fostering demand for visualization solutions.Asia Pacific Data Visualization Market Report:
In 2023, the Data Visualization market in the Asia Pacific region is valued at $3.12 billion and is anticipated to reach $8.36 billion by 2033. This growth is driven by the rapid digital transformation initiatives in countries like India and China, along with the rising awareness of data-driven decision-making. Increasing investments in big data analytics and the cloud are further boosting the market.North America Data Visualization Market Report:
North America holds a significant share in the Data Visualization market, with a valuation of $5.07 billion in 2023 and an expected increase to $13.62 billion by 2033. This growth is largely attributed to the region's advanced technological landscape and the presence of major players like Tableau and Microsoft, which contribute to strong market competition and innovation.South America Data Visualization Market Report:
The South American Data Visualization market was valued at $1.32 billion in 2023 and is projected to reach $3.54 billion by 2033. The growth is fueled by the increasing adoption of digital technologies and the rising need for effective data management solutions among enterprises in Brazil and Argentina.Middle East & Africa Data Visualization Market Report:
The Data Visualization market in the Middle East and Africa is projected to grow from $1.56 billion in 2023 to $4.20 billion by 2033. The rising adoption of digital technologies in sectors like oil and gas, finance, and healthcare is driving demand, alongside investments in IT infrastructure.Tell us your focus area and get a customized research report.
Data Visualization Market Analysis By Industry
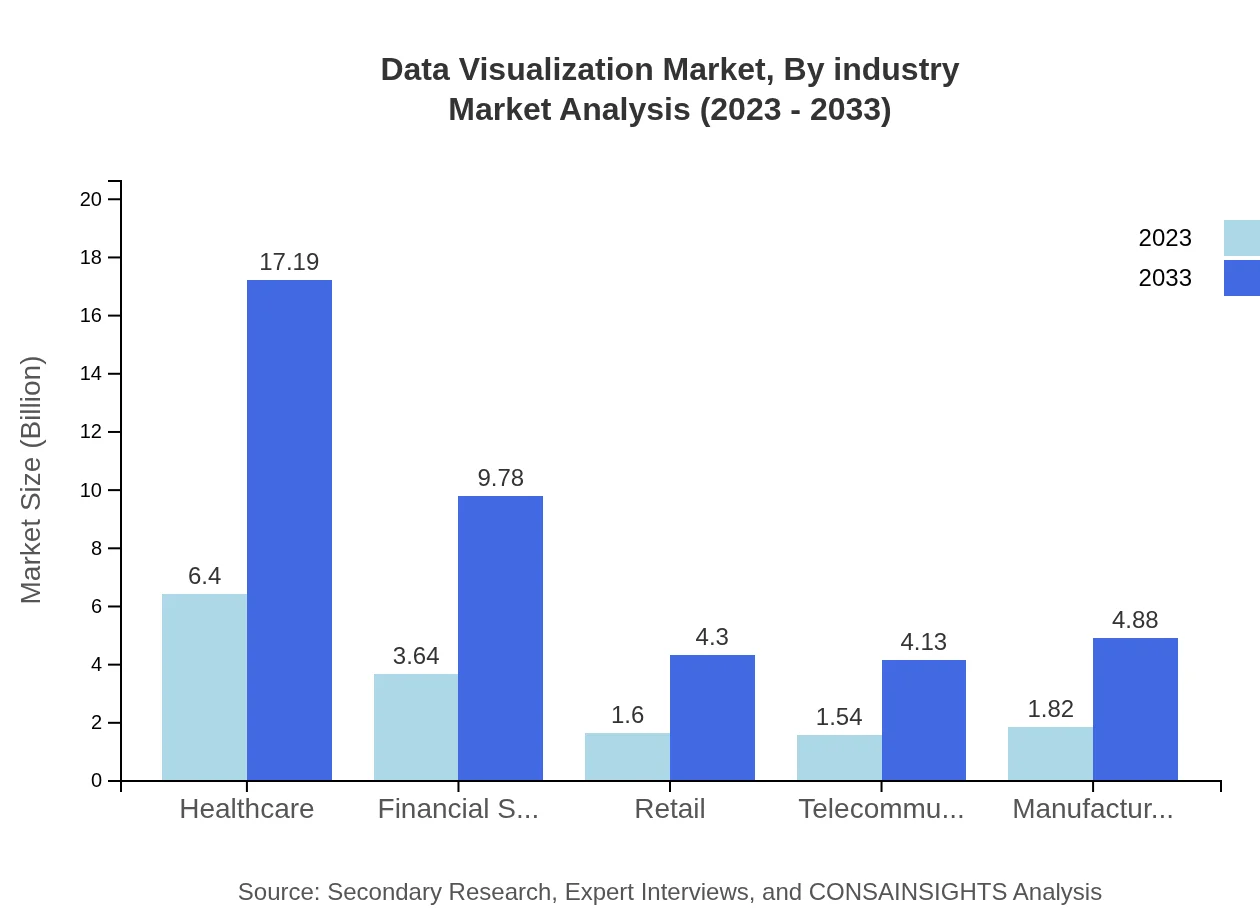
The Data Visualization market segmented by industry shows notable growth, particularly in Healthcare, Financial Services, and Retail. In 2023, the Healthcare segment alone is expected to be valued at $6.40 billion and grow to $17.19 billion by 2033, capturing 42.68% of the market share throughout the forecast period. The Financial Services segment is anticipated to rise from $3.64 billion to $9.78 billion during the same period, maintaining a 24.28% market share. While the Retail segment follows with expected growth from $1.60 billion to $4.30 billion, capturing a market share of 10.67%. The Telecommunications and Manufacturing sectors, with market values of $1.54 billion and $1.82 billion respectively in 2023, project similar growth trajectories, emphasizing the critical need for robust data visualization across industries.
Data Visualization Market Analysis By Tool Type
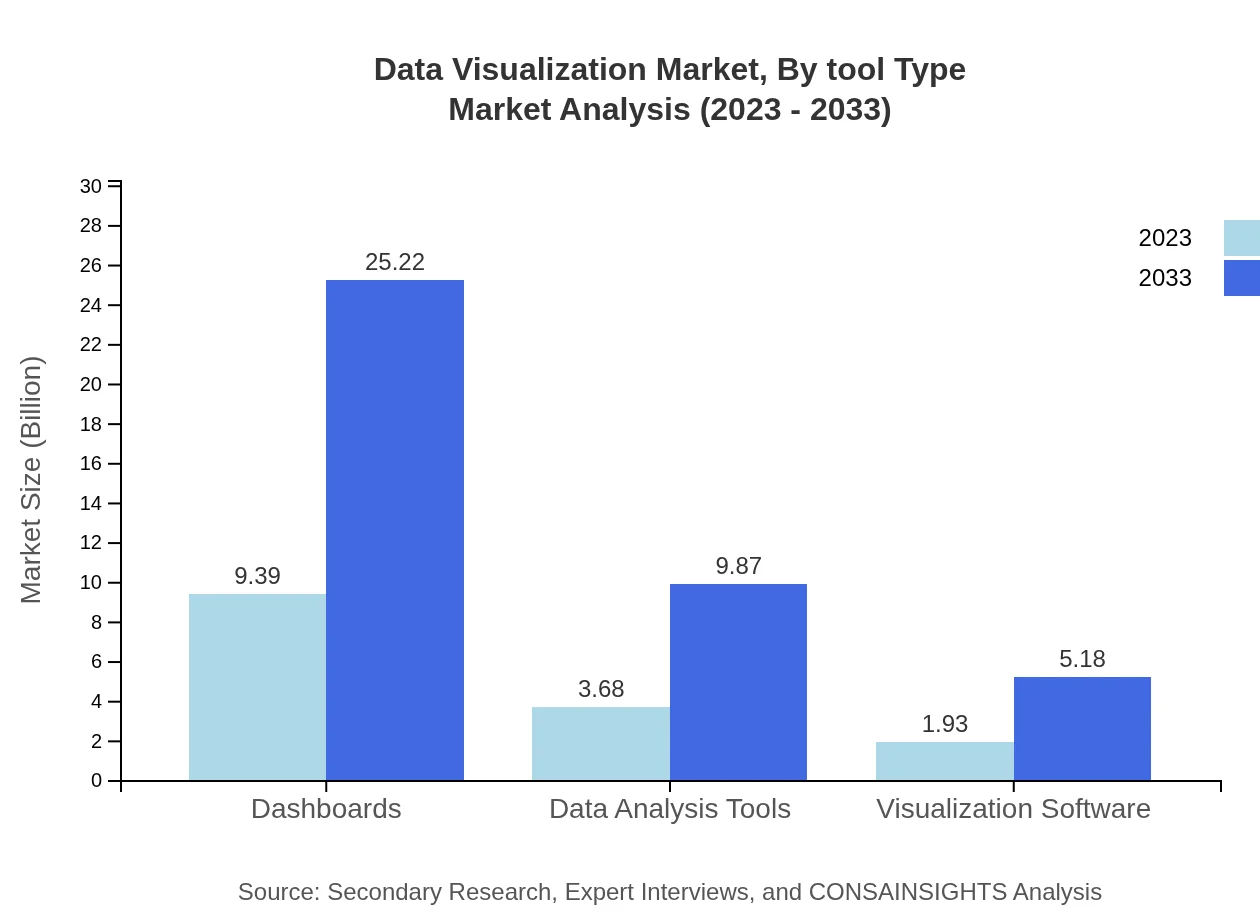
The Data Visualization market is also analyzed based on tool types, which include dashboards, business intelligence tools, data analysis tools, and more. Dashboards dominate the market, contributing significantly with a size of $9.39 billion in 2023, expected to reach $25.22 billion in 2033. Business intelligence tools share an equal growth pattern, starting at $9.39 billion and ending at $25.22 billion within the same timeframe. Data analysis tools and visualization software are also on a growth path, indicating a broader acceptance of diverse visualization methods in operational environments.
Data Visualization Market Analysis By Deployment Model
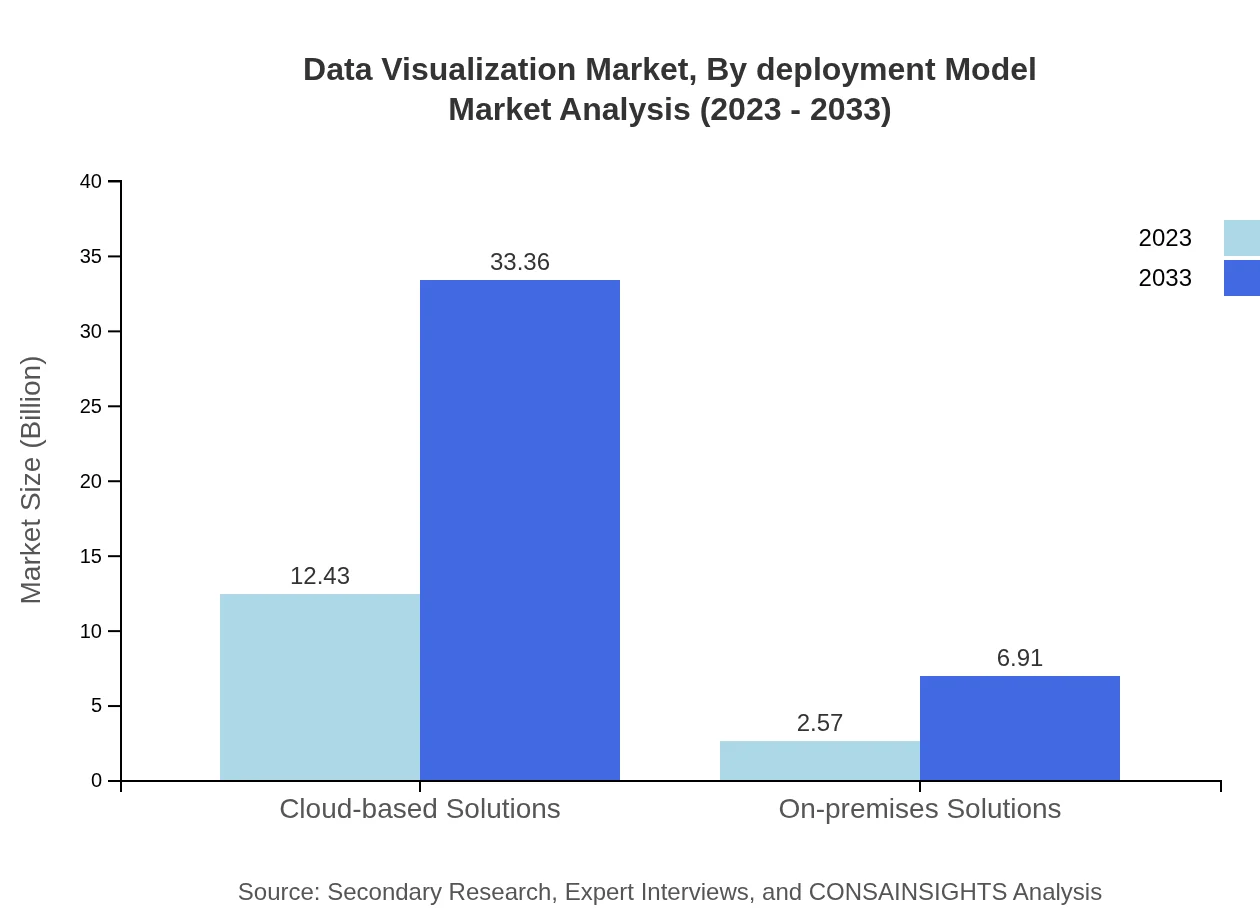
The Data Visualization market is segmented by deployment models into cloud-based and on-premises solutions. Cloud-based solutions lead the market with a size expected to grow from $12.43 billion in 2023 to $33.36 billion in 2033, showcasing a clear trend towards flexibility and accessibility. Conversely, on-premises solutions are projected to grow from $2.57 billion to $6.91 billion, indicating continued demand in industries where data security is paramount, particularly in finance and healthcare sectors.
Data Visualization Market Analysis By Technology

The technology segment reflects ongoing advancements in data visualization techniques, including the use of big data technologies, AI, and machine learning. Big data technologies are projected to see a rise from $3.68 billion to $9.87 billion by 2033, demonstrating the necessity for robust data handling capabilities. The insights drawn from AI and machine learning are increasingly pivotal in enhancing visualization effectiveness and are expected to open new avenues for business intelligence applications.
Data Visualization Market Trends and Future Forecast
Tell us your focus area and get a customized research report.
Global Market Leaders and Top Companies in Data Visualization Industry
Tableau Software:
Tableau is recognized for its powerful data visualization tools that allow users to create interactive and shareable dashboards. The company emphasizes user-friendliness and integration with various data sources.Microsoft Power BI:
Power BI offers a robust suite for business analytics, enabling users to visualize data and share insights across the organization. Its seamless integration with Microsoft products enhances accessibility.Qlik:
Qlik specializes in associative analytics, providing organizations with insights based on real-time data. Their platform encourages exploration and analysis, empowering users to make informed decisions.Domo:
Domo provides cloud-based data visualization services aimed at improving business performance with real-time data insights, helping organizations make efficient decisions.Sisense:
Sisense offers a unique architecture that simplifies complex data integration and visualization, supporting diverse industries in robust data analytics and business intelligence.We're grateful to work with incredible clients.


FAQs
What is the market size of data visualization?
The global data visualization market is valued at $15 billion in 2023. It is projected to grow at a CAGR of 10%, reaching an estimated size by 2033 of approximately $39 billion.
What are the key market players or companies in this data visualization industry?
Key market players in the data visualization industry include leading tech companies and software firms specializing in analytics and visualization tools. Some notable names include Tableau, Microsoft, Qlik, SAP, and Domo, which drive innovation and market growth.
What are the primary factors driving the growth in the data visualization industry?
Growth in data visualization is driven by the increasing volume of data generated, the necessity for real-time analytics, and the demand for improved decision-making capabilities across industries. Additionally, advancements in technology and cloud services contribute significantly to this growth.
Which region is the fastest Growing in the data visualization?
The Asia Pacific region is the fastest-growing area in the data visualization market. It is expected to increase from $3.12 billion in 2023 to $8.36 billion by 2033, highlighting rapid digitization and market adoption in this region.
Does ConsaInsights provide customized market report data for the data visualization industry?
Yes, ConsaInsights offers customized market report data tailored to the specific needs of clients in the data visualization industry. This includes detailed analyses based on unique requirements, enabling businesses to make informed decisions.
What deliverables can I expect from this data visualization market research project?
Deliverables from a data visualization market research project typically include comprehensive reports, data analytics, trends forecasts, and segmented market insights. Additionally, you will receive actionable recommendations tailored to your market needs.
What are the market trends of data visualization?
Key trends in the data visualization market include a shift towards cloud-based solutions, increased adoption of AI and machine learning, and a growing emphasis on user-friendly visual analytics tools. These trends are shaping the future direction of the industry.