Consainsights logo

Digital Map Market Report

Digital Map Market by Product (Software, Hardware, Services), Application (Transportation, Urban Planning, Real Estate, Disaster Management, Agriculture, Tourism, Other Applications) and Region – Analysis on Size, Share, Trends, COVID-19 Impact, Competitive Analysis, Growth Opportunities and Key Insights from 2023 to 2030.

01 Executive Summary

Digital Map Market Size & CAGR

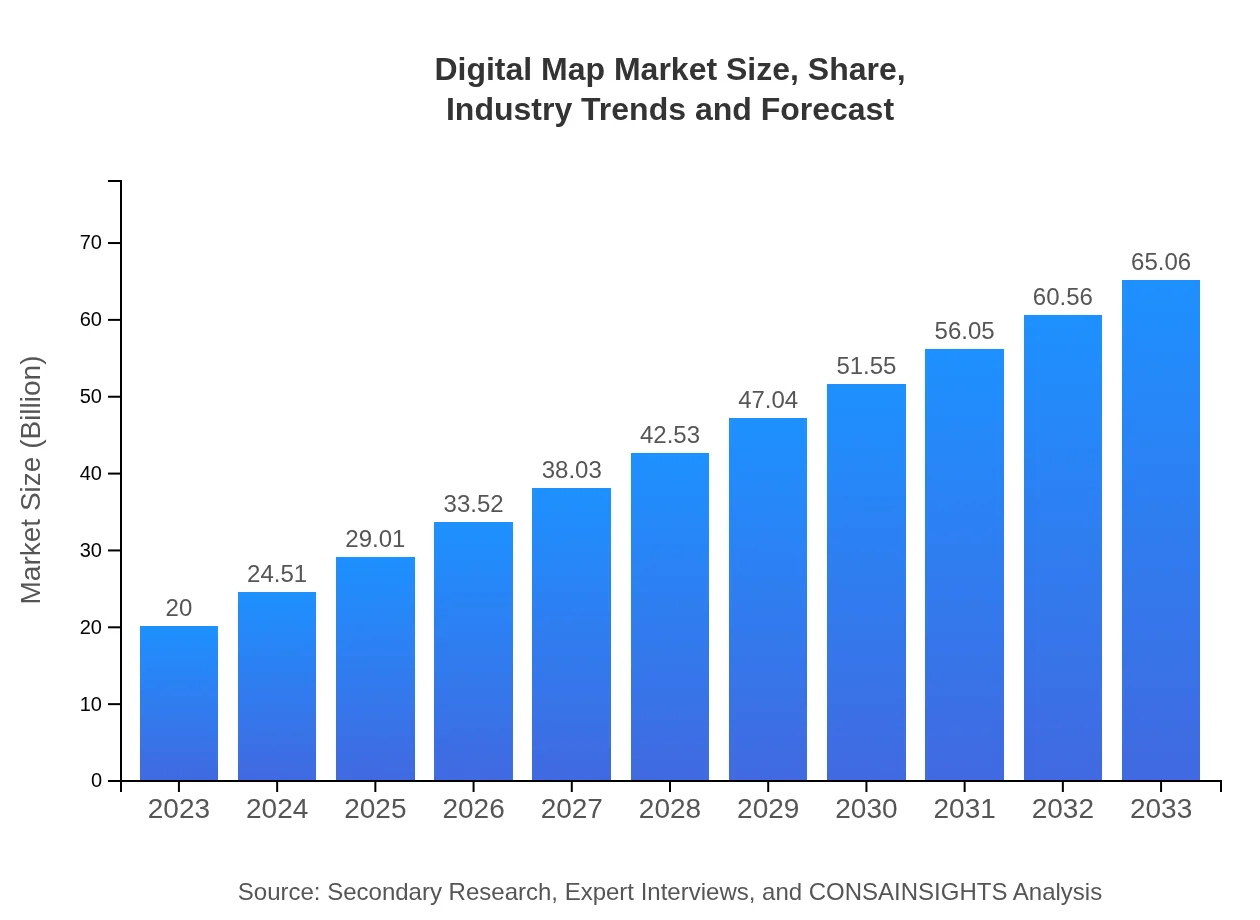
The global Digital Map market size is projected to reach USD 20 billion by 2023, with a Compound Annual Growth Rate (CAGR) of 12% during the forecast period from 2023 to 2030. The increasing adoption of digital mapping technologies across various industries such as transportation, logistics, healthcare, and tourism is driving the growth of the Digital Map market. The market is witnessing a surge in demand for accurate and real-time mapping solutions to enhance navigation, location-based services, and geographic information systems.

COVID-19 Impact on the Digital Map Market

The COVID-19 pandemic has significantly impacted the Digital Map market, causing disruptions in supply chains, project timelines, and overall business operations. The crisis has accelerated the adoption of digital mapping technologies as organizations strive to optimize their operations and facilitate remote work environments. The demand for real-time mapping solutions for tracking the spread of the virus, monitoring containment efforts, and ensuring employee safety has surged during the pandemic.

Furthermore, the travel and tourism industry, which heavily relies on digital mapping services for navigation and location-based services, has been severely affected by the pandemic. The restrictions on movement and travel have led to a decline in demand for mapping solutions in this sector. However, the crisis has also created opportunities for innovative digital mapping technologies to assist in crisis management, emergency response, and public health initiatives.

Digital Map Market Dynamics

The Digital Map market is driven by several key factors, including the increasing use of location-based services, the growing demand for real-time mapping solutions, and the rising adoption of digital mapping technologies in various industries. The market is also influenced by technological advancements such as artificial intelligence, machine learning, and geospatial data analytics, which are enhancing the accuracy and functionality of digital mapping platforms.

However, the market faces challenges related to data privacy and security concerns, as the collection and storage of location-based data raise ethical and regulatory issues. Companies operating in the Digital Map market need to address these challenges by implementing robust data protection measures and ensuring compliance with local and international privacy regulations.

The increasing competition among market players, rapid advancements in mapping technologies, and evolving consumer preferences are shaping the dynamics of the Digital Map market. Companies need to innovate continuously, improve user experience, and expand their product offerings to stay competitive in the rapidly evolving mapping industry.

Segments and Related Analysis of the Digital Map Market

The Digital Map market can be segmented based on technology, product, application, and end-user. By technology, the market is divided into GIS (Geographic Information System), GPS (Global Positioning System), LiDAR (Light Detection and Ranging), and others. By product, the market includes mapping software, mapping platforms, mapping services, and others. In terms of application, the market is categorized into navigation, location-based services, geospatial analysis, and others. Finally, by end-user, the market segments include government, automotive, healthcare, retail, and others.

Digital Map Market Analysis Report by Region

Asia Pacific Digital Map Market Report

The Asia Pacific region is witnessing significant growth in the Digital Map market, driven by the increasing adoption of digital mapping technologies in countries like China, Japan, and India. The rapid urbanization, infrastructure development, and expansion of e-commerce and logistics industries in the region are fueling the demand for accurate mapping solutions. Government initiatives to promote smart city development and improve transportation networks are also contributing to the growth of the Digital Map market in Asia Pacific.

South America Digital Map Market Report

The South America region is experiencing steady growth in the Digital Map market, with countries like Brazil and Argentina leading the adoption of mapping technologies. The growth of the agriculture, mining, and oil & gas industries in South America is driving the demand for advanced mapping solutions for land surveying, exploration, and resource management. The increasing focus on environmental conservation and disaster management is also creating opportunities for digital mapping technologies in the region.

North America Digital Map Market Report

North America is a mature market for Digital Map technologies, with the United States and Canada at the forefront of innovation and adoption. The region is home to several key players in the mapping industry, who are driving advancements in GIS, GPS, and LiDAR technologies. The strong presence of automotive, transportation, and technology companies in North America is fueling the demand for digital mapping solutions for autonomous vehicles, smart cities, and location-based services. The region also has a robust regulatory framework for data privacy and security, influencing the adoption of mapping technologies.

Europe Digital Map Market Report

Europe is a competitive market for Digital Map technologies, with countries like the United Kingdom, Germany, and France leading in innovation and development. The region's focus on sustainable urban planning, environmental conservation, and infrastructure modernization is driving the demand for accurate mapping solutions. The European Union's initiatives to promote smart mobility, digital transformation, and data interoperability are shaping the landscape of the Digital Map market in Europe. The presence of key players like HERE Technologies, TomTom, and Hexagon Geospatial is further boosting the growth of the market in the region.

Middle East and Africa Digital Map Market Report

The Middle East and Africa region are witnessing growth in the Digital Map market, fueled by the rapid urbanization, infrastructure development, and digital transformation initiatives. Countries like Saudi Arabia, the UAE, and South Africa are investing in smart city projects, renewable energy infrastructure, and transportation networks, driving the demand for advanced mapping solutions. The growing focus on disaster management, environmental monitoring, and resource exploration is creating opportunities for digital mapping technologies in the Middle East and Africa.

Digital Map Market Analysis Report by Technology

The Digital Map market can be analyzed based on different technologies such as GIS, GPS, LiDAR, and others. Geographic Information System (GIS) technology is widely used for spatial data analysis, mapping, and visualization. Global Positioning System (GPS) technology enables accurate location tracking and navigation. Light Detection and Ranging (LiDAR) technology uses laser pulses to measure distances, creating detailed 3D maps. Other emerging technologies in the Digital Map market include aerial imaging, satellite mapping, augmented reality, and artificial intelligence.

Digital Map Market Analysis Report by Product

The Digital Map market offers a range of products such as mapping software, mapping platforms, mapping services, and others. Mapping software includes desktop applications, web-based tools, and mobile apps for creating, editing, and analyzing maps. Mapping platforms provide developers with APIs and SDKs to integrate mapping functionality into their applications. Mapping services offer data collection, processing, and visualization services for customized mapping solutions. Other products in the Digital Map market include GPS devices, wearables, drones, and IoT sensors for location-based services.

Digital Map Market Analysis Report by Application

The Digital Map market applications include navigation, location-based services, geospatial analysis, and others. Navigation applications use digital maps for route planning, real-time traffic updates, and turn-by-turn directions. Location-based services provide personalized information based on the user's location, such as nearby businesses, events, and points of interest. Geospatial analysis applications use mapping data for spatial modeling, environmental monitoring, urban planning, and disaster management. Other applications of digital maps include agriculture, forestry, wildlife conservation, and urban sustainability.

Digital Map Market Analysis Report by End-User

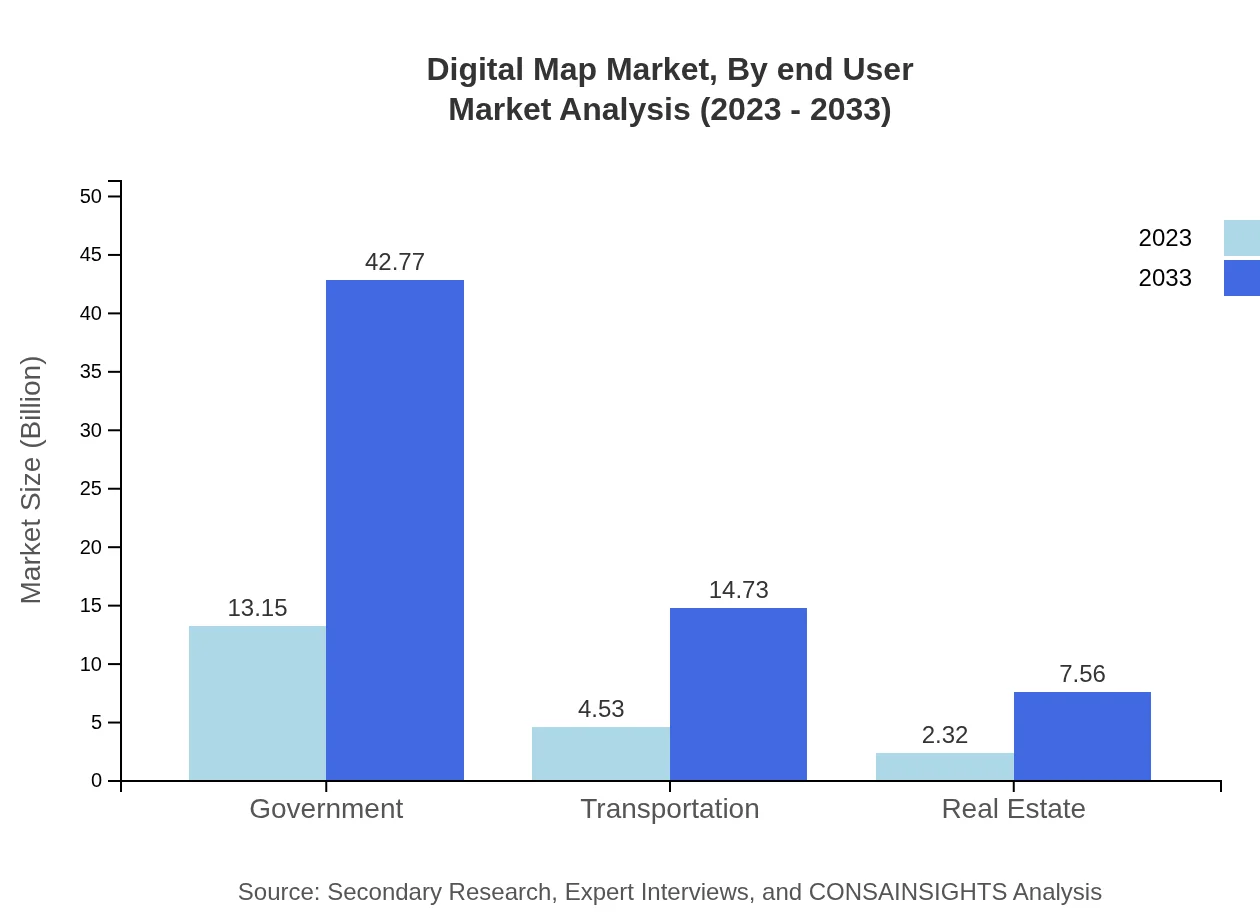
The Digital Map market serves various end-users such as government, automotive, healthcare, retail, and others. Government agencies use digital maps for urban planning, land management, emergency response, and defense applications. The automotive industry relies on mapping technologies for autonomous driving, vehicle tracking, and fleet management. Healthcare providers utilize digital maps for patient mapping, facility management, and epidemiological studies. Retail businesses leverage location-based services for marketing, customer engagement, and store optimization. Other end-users of digital mapping technologies include agriculture, construction, tourism, and education sectors.

Key Growth Drivers and Key Market Players of Digital Map Market and Competitive Landscape

The Digital Map market is driven by key growth drivers such as the increasing demand for real-time mapping solutions, the growing use of location-based services, and the rising adoption of geospatial technologies across industries. The market is characterized by intense competition among key players such as Google Maps, Apple Maps, HERE Technologies, TomTom, Esri, and OpenStreetMap. These companies offer a wide range of mapping products and services, including navigation apps, mapping platforms, geospatial analytics, and location-based APIs.

The competitive landscape of the Digital Map market is dominated by established players with global reach and extensive product portfolios. Google Maps, a subsidiary of Alphabet Inc., is a leading provider of mapping services with a focus on user-friendly navigation and location-based services. Apple Maps, developed by Apple Inc., offers detailed mapping data, indoor mapping, and privacy-focused features. HERE Technologies, a Netherlands-based company, specializes in automotive mapping, location intelligence, and fleet management solutions. TomTom, a Dutch navigation technology company, provides mapping software, GPS devices, and traffic information services. Esri, an American provider of GIS software, offers geospatial analytics, mapping tools, and location-based services. OpenStreetMap, a collaborative mapping project, provides free and editable map data for public use.

Digital Map Market Trends and Future Forecast

The Digital Map market is witnessing several trends that are shaping the future of mapping technologies. One trend is the integration of artificial intelligence and machine learning algorithms into mapping platforms to enhance data analysis, predictive modeling, and personalized recommendations. Another trend is the growth of 3D mapping technologies for immersive virtual navigation, augmented reality experiences, and urban planning simulations. The increasing use of drones, IoT sensors, and satellite imagery for data collection and mapping is also driving innovation in the Digital Map market. Future forecasts predict continued growth in the demand for mapping solutions across industries, with a focus on accuracy, real-time updates, and seamless integration with IoT devices.

Recent Happenings in the Digital Map Market

In recent developments, Google Maps announced new features such as real-time parking availability, eco-friendly route options, and AR navigation for pedestrians. Apple Maps introduced 3D indoor mapping for airports and shopping malls, along with enhanced privacy features for location sharing. HERE Technologies partnered with NVIDIA to develop high-definition live maps for autonomous vehicles, leveraging AI and computer vision technologies. TomTom expanded its mapping coverage in Asia and Africa, focusing on improving navigation accuracy and updating traffic information. Esri launched a new platform for real-time mapping and data visualization, enabling organizations to monitor environmental changes, infrastructure projects, and spatial trends.

GLOBAL ARTIFICIAL INTELLIGENCE MARKET SIZE, BY PRODUCT, 2023-2030 (USD BILLION)

By Product20232024202520262027202820292030CAGR (2023-2030)
Forecast
Softwarexxxxxxxxxxxxxxxxxx
Hardwarexxxxxxxxxxxxxxxxxx
Servicesxxxxxxxxxxxxxxxxxx
Source: Secondary Research, Expert Interviews, and CONSAINSIGHTS Analysis

GLOBAL ARTIFICIAL INTELLIGENCE MARKET SIZE, BY SOFTWARE, 2023-2030 (USD BILLION)

Software20232024202520262027202820292030CAGR (2023-2030)
Forecast
Mapping Softwarexxxxxxxxxxxxxxxxxx
Navigation Softwarexxxxxxxxxxxxxxxxxx
Geo-analytics Softwarexxxxxxxxxxxxxxxxxx
Source: Secondary Research, Expert Interviews, and CONSAINSIGHTS Analysis

GLOBAL ARTIFICIAL INTELLIGENCE MARKET SIZE, BY HARDWARE, 2023-2030 (USD BILLION)

Hardware20232024202520262027202820292030CAGR (2023-2030)
Forecast
Mapping Devicesxxxxxxxxxxxxxxxxxx
GPS Devicesxxxxxxxxxxxxxxxxxx
Drones for Mappingxxxxxxxxxxxxxxxxxx
Source: Secondary Research, Expert Interviews, and CONSAINSIGHTS Analysis

GLOBAL ARTIFICIAL INTELLIGENCE MARKET SIZE, BY SERVICES, 2023-2030 (USD BILLION)

Services20232024202520262027202820292030CAGR (2023-2030)
Forecast
Consulting Servicesxxxxxxxxxxxxxxxxxx
Mapping and Analysis Servicesxxxxxxxxxxxxxxxxxx
Maintenance and Support Servicesxxxxxxxxxxxxxxxxxx
Source: Secondary Research, Expert Interviews, and CONSAINSIGHTS Analysis

GLOBAL ARTIFICIAL INTELLIGENCE MARKET SIZE, BY APPLICATION, 2023-2030 (USD BILLION)

By Application20232024202520262027202820292030CAGR (2023-2030)
Forecast
Transportationxxxxxxxxxxxxxxxxxx
Urban Planningxxxxxxxxxxxxxxxxxx
Real Estatexxxxxxxxxxxxxxxxxx
Disaster Managementxxxxxxxxxxxxxxxxxx
Agriculturexxxxxxxxxxxxxxxxxx
Tourismxxxxxxxxxxxxxxxxxx
Other Applicationsxxxxxxxxxxxxxxxxxx
Source: Secondary Research, Expert Interviews, and CONSAINSIGHTS Analysis

02 Research Methodology

Our research methodology entails an ideal mixture of primary and secondary initiatives. Key steps involved in the process are listed below:

  • Step 1. Data collection and Triangulation

    This stage involves gathering market data from various sources to ensure accuracy and comprehensiveness.

  • Step 2. Primary and Secondary Data Research

    Conducting in-depth research using both primary data (interviews, surveys) and secondary data (reports, articles) to gather relevant information.

  • Step 3. Data analysis

    Analyzing and interpreting the collected data to identify patterns, trends, and insights that can inform decision-making.

  • Step 4. Data sizing and forecasting

    Estimating the size of the market and forecasting future trends based on the analyzed data to guide strategic planning.

  • Step 5. Expert analysis and data verification

    Engaging subject matter experts to review and verify the accuracy and reliability of the data and findings.

  • Step 6. Data visualization

    Creating visual representations such as charts and graphs to effectively communicate the data findings to stakeholders.

  • Step 7. Reporting

    Compiling a comprehensive report that presents the research findings, insights, and recommendations in a clear and concise manner.

Data collection and Triangulation

The foundation is meticulous data gathering from multiple primary and secondary sources through interviews, surveys, industry databases, and publications. We critically triangulate these data points, cross-verifying and correlating findings to ensure comprehensiveness and accuracy.

Primary and Secondary Data Research

Our approach combines robust primary research discussion with industry experts and an exhaustive study of secondary data sources. A comprehensive analysis of published information from credible databases, journals, and market research reports complements direct interactions with industry stakeholders and key opinion leaders.

Data analysis

With a wealth of data at our disposal, our seasoned analysts meticulously examine and interpret the findings. Leveraging advanced analytical tools and techniques, we identify trends, patterns, and correlations, separating signal from noise to uncover profound insights that shed light on market realities.

Data sizing and forecasting

Armed with a profound understanding of market dynamics, our specialists employ robust statistical models and proprietary algorithms to size markets accurately. We go a step further, harnessing our predictive capabilities to forecast future trajectories, empowering clients with foresight for informed decision-making.

Expert analysis and data verification

Our research findings undergo a rigorous review by a panel of subject matter experts who lend their deep industry knowledge. This critical analysis ensures our insights are comprehensive and aligned with real-world dynamics. We also meticulously verify each data point, leaving no stone unturned in our pursuit of accuracy.

Data visualization

To unlock the true potential of our research, we employ powerful data visualization techniques. Our analysts transform complex datasets into intuitive visuals, including charts, graphs, and interactive dashboards. This approach facilitates seamless communication of key insights, enabling stakeholders to comprehend market intricacies at a glance.

Reporting

The final step is providing detailed reports that combine our in-depth analysis with practical advice. Our reports are designed to give clients a competitive edge by clearly explaining market complexities and highlighting emerging opportunities they can take advantage of.

03 Digital Map Market Overview

Market Definition and Scope
Market Segmentation
Currency
Forecast
Assumptions

Market Definition and Scope

The digital map market encompasses an extensive range of applications and technologies that provide spatial data and geographic information in a digital format. This market includes various types of mapping solutions such as satellite imagery, street maps, terrain maps, and online mapping services that are integral to a multitude of industries. The growth of the digital map market is largely driven by advancements in satellite and geospatial technology, which have significantly enhanced map accuracy and functionality for end-users.

Digital maps can be accessed through a variety of devices including smartphones, tablets, and computers, allowing consumers and businesses to utilize mapping applications for navigation, logistics, urban planning, and emergency response among others. The scope of the digital map market is not limited to consumer applications; it also includes professional and enterprise-level solutions designed for specialized fields such as transportation, tourism, real estate, and environmental monitoring. The integration of GIS (Geographic Information Systems) technology into the mapping process has further expanded the market scope by allowing users to analyze and visualize spatial data efficiently.

The digital map market also plays a crucial role in enhancing user experience in various sectors by providing accurate, real-time data and interactive features. These include augmented reality navigation, location-based services, and detailed route planning tools which significantly improve operational efficiency for businesses as well as convenience for individual users. Additionally, the collaboration between digital map services and emerging technologies such as Artificial Intelligence (AI) and Big Data analytics is setting new benchmarks for map utility, leading to more informed decision-making processes in multiple applications.

As urbanization progresses and the demand for effective navigation solutions surges, the market for digital maps is expected to broaden. This growth trajectory is fueled by various factors including the rising adoption of cloud-based solutions, increased smartphone penetration, and the growing need for sophisticated geospatial data analysis. Moreover, the digital map market is finding opportunities in developing countries where the infrastructure is rapidly advancing, creating a new vista for providers to cater to an emerging consumer base that requires efficient mapping solutions.

In summary, the digital map market is not only defined by its wide-ranging applications and technology integration but also shaped by the dynamic landscape of consumer and enterprise needs. With innovations continuously reshaping the capabilities of digital maps, the potential for growth, expansion, and enhanced user engagement is promising, making it a pivotal component in the broader technology ecosystem.

Market Segmentation

The digital map market is segmented based on various criteria including type, application, and geography, each presenting unique trends and growth opportunities. The types of digital maps can broadly be classified into raster maps, vector maps, and 3D maps. Raster maps are image-based maps that consist of pixels, making them ideal for representing complex visual details such as satellite imagery. On the other hand, vector maps utilize mathematical equations to represent geographic features, allowing for manipulation without loss of quality. 3D maps provide a visual representation of terrain, adding depth to geographical information which is particularly useful for applications such as urban planning and real estate development.

The application segmentation of the digital map market can be categorized into several key areas including automotive, mobile applications, government services, and businesses. In the automotive sector, the demand for digital mapping solutions is propelled by the rise of autonomous vehicles and advanced driver-assistance systems (ADAS) that require precise mapping for optimal functionality. Mobile applications, facilitated by GPS technology, have transformed personal navigation, enabling real-time tracking and route optimization for individual users. Government services also leverage digital maps for urban planning, infrastructure development, and disaster management, bringing innovation and efficiency into public service delivery.

Geographically, the digital map market is divided into regions including North America, Europe, Asia Pacific, Latin America, and the Middle East & Africa. North America leads the market, driven by technological advancements, high digital penetration, and the presence of major tech companies specializing in digital mapping solutions. Conversely, the Asia Pacific region is witnessing rapid growth due to urbanization, increased internet connectivity, and rising smartphone usage, creating a robust environment for digital map adoption.

Furthermore, segmentation also extends to the identification of key stakeholders in the digital map ecosystem, which includes mapping service providers, technology companies, and end-users. Understanding the role of each player within the market is essential for strategic planning and competitive analysis. With the segmentation of the digital map market becoming increasingly nuanced, it provides insight into consumer preferences and emerging trends that can inform product development and marketing strategies.

In conclusion, market segmentation is a critical aspect of the digital map industry that allows stakeholders to comprehend distinct avenues for growth and development. By analyzing the varied segments, participants in the digital mapping market can strategize effectively to meet the changing demands of users, drive innovation, and enhance the overall landscape of digital geographic information.

Currency

The digital map market operates primarily in US dollars, facilitating international transactions between various stakeholders. The use of a single, standardized currency simplifies pricing strategies and financial reporting for companies engaged in this global sector, ensuring consistency and clarity in trading across borders. Pricing for digital map solutions typically reflects the costs associated with technology development, data acquisition, and the integration of advanced features such as real-time updates and user analytics.

Moreover, as businesses increasingly adopt subscription-based models for digital maps, understanding currency fluctuations becomes vital for companies aiming to maintain competitiveness in a global marketplace. Subscription pricing can vary significantly based on the geographical location of the user, which is influenced by local economic conditions and currency valuations. This introduces a layer of complexity that companies must navigate while establishing pricing structures that appeal to users across different regions.

In the context of growing international collaborations and partnerships, the use of diverse currencies alongside US dollars can sometimes be observed, particularly in joint ventures or localized offerings where regional currencies play a role in financial transactions. This allows companies to tailor pricing and service offerings to better meet the needs of specific markets, while also mitigating the risks associated with currency exchange rates.

Additionally, the necessity for transparency in pricing information across different jurisdictions, depending on currency values, can affect consumer trust and satisfaction. Companies must ensure that their pricing strategies, regardless of currency used, are clear and accessible, fostering an equitable understanding of costs across their global clientele.

In summary, currency plays a crucial role in the digital map market by influencing pricing strategies, operational decisions, and international trade dynamics. Understanding the implications of currency on market behavior helps companies in making informed decisions about pricing, partnerships, and overall strategic direction in a competitive landscape.

Forecast

Forecasting the future growth of the digital map market involves analyzing several key indicators including technological advancements, increasing consumer demand, and industry trends. Analysts predict that the digital map market is poised for robust growth over the next several years, driven largely by the integration of geolocation services into an ever-widening array of applications. The proliferation of smart devices and the Internet of Things (IoT) is expected to enhance the visibility and accessibility of digital mapping technologies, further boosting market penetration.

Another significant growth driver is the rising interest in autonomous transportation systems which rely heavily on accurate mapping for navigation and decision-making. As automotive manufacturers continue to invest heavily in connected vehicle technologies, the demand for real-time, high-resolution maps will increase, propelling the growth of the digital map market. This trend is compounded by advancing machine learning and AI technologies that enhance the capacity for data processing and map updates, ensuring that users receive the most current information available.

The tourism and hospitality sectors are expected to embrace digital map solutions more extensively, as businesses aim to provide personalized experiences for travelers. Enhanced location-based services that offer dynamically tailored recommendations based on user preferences are predicted to be in high demand, signaling a shift towards more user-centric digital mapping solutions. Moreover, as smart city initiatives gain momentum globally, the integration of digital maps into urban planning processes will play a pivotal role in improving the efficiency and sustainability of urban environments.

In financial terms, the growth of the digital map market is also tied to the expansion of e-commerce and online services, which increasingly rely on logistically efficient mapping systems. Consumers' rising expectations for seamless delivery experiences require businesses to invest in sophisticated mapping solutions that enable optimal routing and geographic analysis, thus influencing their competitive edge in the digital marketplace.

Overall, the digital map market is set to experience significant growth due to technological innovation, evolving consumer preferences, and the increasing demand for location-based services. By capitalizing on these emerging trends, businesses within the digital map ecosystem can position themselves to thrive in a rapidly changing landscape, ultimately contributing to the market's robust forecast for the coming years.

Assumptions

A key element in analyzing the digital map market involves understanding the underlying assumptions that shape market dynamics and influence forecasting results. One primary assumption is the continued growth and accessibility of advanced digital technologies, including GPS, GIS, and AI, which are foundational for developing sophisticated digital maps. Analysts expect that as technology evolves, the cost of accessing and utilizing these tools will decrease, enabling broader adoption across diverse sectors and geographies.

Another assumption is the increasing reliance on digital maps by industries inherently linked to geography, such as logistics, real estate, and urban planning. As these industries continue to grow, the expectation is that demand for precise and user-friendly mapping solutions will also rise. Therefore, the digital map market should anticipate an influx of users requiring customized tools that cater to their specific operational needs, fueling further innovation and investment within the market.

In addition, it is assumed that the regulatory landscape surrounding data usage, privacy, and geographic information will continue to evolve. Policymakers are increasingly focused on establishing frameworks that not only protect user privacy but also facilitate the safe sharing and utilization of geospatial data. This evolving landscape is likely to affect how digital map services operate and may require them to adapt to new compliance challenges, ultimately influencing market dynamics.

Further, the assumption of sustained economic growth across key markets is critical for the digital map sector. As economies rebound and consumer spending increases, there will be more impetus for industries to invest in technologies that improve operational efficiencies, including digital mapping solutions. This economic climate can serve as a catalyst for further investment and gathering momentum for the digital map market.

Finally, an assumption many analysts make is the role of consumer behavior in driving demand for digital maps. With consumers becoming increasingly tech-savvy and expecting real-time information and navigation solutions, companies must continue to innovate and enhance user experiences. Meeting these evolving consumer expectations will be a determining factor for companies navigating the digital mapping landscape, influencing market growth and strategic decisions.

04 Digital Map Market Dynamics

Market Drivers
Market Restraints
Market Opportunities
Market Challenges

Market Drivers

The digital map market is primarily driven by the increasing demand for geographical data in various industries, including logistics, transportation, and urban planning. As businesses and governments seek to make informed decisions based on location intelligence, the need for precise and real-time geographical data becomes paramount. This growing reliance on digital maps for operational efficiency and strategic planning continues to propel market growth.

Advancements in technology further stimulate the digital map market by enabling the creation of high-resolution maps that offer detailed views of geographical areas. Innovations in satellite imagery and geographic information systems (GIS) provide richer datasets that can help users analyze complex spatial phenomena, leading to better decision-making and improved planning processes.

The rise of mobile technology has also played a significant role in driving the market. As smartphones and tablets become ubiquitous, the demand for mobile applications that rely on digital maps for navigation and location services has surged. This trend fosters a wider adoption of mapping technologies among consumers, fueling the need for comprehensive digital mapping solutions.

Moreover, the increasing focus on smart city initiatives is a powerful driver for the digital map market. Governments worldwide are investing in smart infrastructure that leverages digital mapping for urban management, traffic control, and public safety. Such initiatives create a robust demand for advanced mapping solutions that can support the complex needs of modern urban environments.

Finally, the growth of e-commerce is contributing to the market's expansion, as companies require reliable mapping services for efficient logistics and delivery operations. As online shopping continues to grow, the need for accurate geolocation and route optimization becomes more critical, thereby boosting the demand for advanced digital mapping technologies.

Market Restraints

Despite the promising prospects of the digital map market, several factors are impeding its growth. A primary restraint is the issue of data privacy and security. As digital maps collect and utilize vast amounts of location-based data, concerns surrounding how this information is stored and used can deter potential users. Increased scrutiny from regulators and consumers regarding data protection complicates the deployment of mapping technologies.

Another significant restraint is the high cost associated with producing and maintaining high-quality digital maps. Developing accurate, up-to-date maps requires significant investments in technology, personnel, and data acquisition. For smaller companies, these costs can be prohibitive, limiting competition and hindering innovation within the market.

Moreover, the digital divide remains a persistent obstacle. In many regions around the world, particularly in developing nations, access to reliable internet and advanced technological infrastructure is limited. This disparity prevents the widespread adoption of digital mapping solutions and restricts the market's potential growth in these underserved areas.

Technical challenges also pose a threat to the digital map market. The complexity of integrating various data sources and ensuring the accuracy and reliability of mapping information can present significant hurdles. Inaccurate mapping data can lead to erroneous decisions, resulting in dissatisfaction among users and eroding trust in mapping technologies.

Finally, the fast pace of technological change presents a challenge as companies must continuously innovate and adapt to stay relevant. Firms that fail to keep up with the latest advancements may find themselves outpaced by competitors, leading to potential losses in market share and profitability.

Market Opportunities

While the digital map market faces barriers, it is also rife with opportunities for growth and innovation. One of the most significant opportunities lies in the integration of artificial intelligence (AI) and machine learning into mapping technologies. These innovations can enhance the accuracy, detail, and utility of maps by enabling predictive analysis and real-time data processing, thereby offering users enhanced functionalities and insights.

The expansion of the Internet of Things (IoT) presents another promising opportunity. As more devices become interconnected and generate location data, the need for digital maps that can integrate and visualize this data becomes crucial. This opens up possibilities for developing advanced mapping applications that cater to diverse industries, including automotive, healthcare, and tourism.

Furthermore, the growing demand for augmented reality (AR) applications offers a substantial opportunity for digital mapping solutions. With the rise of AR technologies, there is a burgeoning market for interactive mapping experiences that can enhance user engagement, particularly in retail, education, and gaming sectors. Mapping companies that leverage AR capabilities can establish a competitive advantage.

The ongoing trend towards sustainable urban development is also driving opportunities in the digital map market. Governments and organizations are increasingly focusing on green initiatives, creating demand for mapping tools that help track and manage resources, assess environmental impact, and optimize land use. Solutions that provide insights into sustainable practices can attract investments and partnerships.

Lastly, the expansion of autonomous vehicles is set to revolutionize the digital map landscape. As these vehicles rely on precise mapping for navigation and obstacle detection, the demand for detailed and continuously updated mapping solutions will skyrocket. Companies that invest in the creation of robust mapping technologies catering to autonomous operations will benefit substantially from this trend.

Market Challenges

The digital map market faces several challenges that could impact its growth trajectory. One notable challenge is the rapid technological evolution that necessitates constant updates and improvements in mapping technologies. Companies must be agile and responsive to maintain the relevance of their products, which can be resource-intensive and a strain on financial and human capital.

Additionally, competition within the market is intense, with many players vying for dominance in a relatively crowded space. This competition can lead to price wars, reducing profit margins and forcing companies to differentiate themselves through superior service and innovative features. Companies that fail to innovate may struggle to retain market share in this highly dynamic environment.

Another significant challenge is the need for cross-border collaboration and standardization in mapping data. Different regions may utilize varying mapping technologies and standards, creating complications in data sharing and integration. Such discrepancies can hinder the effectiveness and usability of digital maps, making it essential for mapping organizations to work toward common standards globally.

Moreover, the potential for technological disruptions, such as cybersecurity threats, poses considerable risks to the digital map market. With the increasing reliance on digital data, mapping solutions become potential targets for cyber-attacks, which can compromise data integrity and user trust. Ensuring robust security measures and preparedness against such threats is essential for sustaining the market's growth.

Lastly, the reliance on a single source of data can lead to vulnerabilities. If companies depend heavily on specific providers for mapping data, any disruptions or inaccuracies from these sources can significantly impact the quality and reliability of mapping services. Diversifying data sources and developing contingency plans are crucial strategies to mitigate these risks.

06 Regulatory Landscape

Overview of Regulatory Framework
Impact of Regulatory Policies on Market Growth

Overview of Regulatory Framework

In recent years, the digital map industry has witnessed significant growth, driven by advancements in technology and increasing demand for navigation solutions. However, this growth has been accompanied by a complex web of regulatory frameworks that govern various aspects of digital mapping. These regulations vary by country and are influenced by factors such as privacy concerns, data accuracy, and intellectual property rights.

At the international level, regulatory bodies have started to recognize the importance of creating a harmonized approach to digital map regulations. This is essential to ensure that map data is used responsibly and ethically, particularly as it relates to user privacy. Organizations such as the International Telecommunication Union (ITU) are actively researching and proposing guidelines for the use of mapping technologies.

Regionally, regulations often focus on the licensing of geographic information systems (GIS), data sharing practices, and compliance with national security protocols. For instance, in the European Union, the General Data Protection Regulation (GDPR) has significant implications for how companies collect and process location data. Any business operating in the EU must ensure that its mapping practices comply with stringent privacy standards.

In the United States, the regulatory landscape is more fragmented, with federal, state, and local regulations all playing a role. Federal laws, such as the Fair Information Practices (FIP), guide how personal data should be handled. State regulations can vary widely, creating challenges for companies that operate across multiple jurisdictions. Consequently, businesses must navigate this complex regulatory environment to ensure compliance and avoid potential penalties.

This regulatory landscape is not static; it continues to evolve in response to technological developments and societal changes. As innovations such as autonomous vehicles and smart city infrastructure become more prevalent, regulators will likely adapt existing laws or introduce new regulations to address emerging challenges. The ability of companies to influence these regulatory developments will be crucial to their success in the digital mapping market.

Impact of Regulatory Policies on Market Growth

The effects of regulatory policies on the digital map market are profound, impacting not only the operations of mapping companies but also their growth potential. Regulatory frameworks can create both opportunities and challenges. For businesses that can effectively navigate the regulatory landscape, there is potential for significant growth, particularly in regions where regulations are supportive of innovation.

For instance, regulations that promote data sharing and collaboration among public and private entities can foster a richer ecosystem for digital map services. An example of this is the establishment of open data initiatives, which encourage governments to open up geospatial data to the public. This can lead to enhanced competition, allowing startups and existing companies to leverage publicly available data, thus driving innovation and market expansion.

On the flip side, stringent regulations can hinder growth by imposing significant compliance costs on companies. Businesses may need to invest in advanced technologies and processes to ensure compliance, which can divert resources from research and development efforts. For smaller companies with limited budgets, this can be particularly challenging and may inhibit their ability to compete with larger, more established firms.

The regulatory environment also directly influences customer trust and usage behaviors. Clear regulations regarding data privacy help to build consumer confidence in digital mapping services. When users are assured that their location data is being handled responsibly, they are more likely to engage with these technologies. Conversely, regulatory ambiguities can lead to mistrust, limiting market penetration and potential growth.

07 Impact of COVID-19 on the Artificial Intelligence Market

Short-term and Long-term Implications

Short-term Implications

The COVID-19 pandemic has significantly affected the digital map market, particularly in the short term. Initially, the health crisis led to a sharp decline in travel and tourism, which are key sectors that depend heavily on mapping services. With lockdowns and restrictions in place, usage of mapping applications by tourists and travelers plummeted, resulting in a temporary dip in revenue for companies operating in this space.

Additionally, the sudden shift in work patterns as a result of lockdowns meant that many businesses transitioned to remote work. This transition reduced the need for geographical navigation for commuting, which typically drives daily use of digital map solutions. As companies adapted to a work-from-home model, the demand for location-based services also saw a striking reduction.

However, some unexpected short-term opportunities arose from the pandemic. For instance, essential services such as delivery and logistics became paramount, escalating the need for real-time mapping and navigation solutions. Companies involved in last-mile delivery rapidly adapted their services to meet this surge in demand, highlighting the versatility and adaptability of digital mapping technologies in crisis scenarios.

Long-term Implications

Looking toward the long-term implications, the digital map market is poised for a transformation post-COVID-19. As restrictions ease and global travel resumes, there is an anticipated resurgence in demand for mapping services. Businesses are likely to innovate and enhance their offerings, ensuring robust functionality that can accommodate a hybrid model of commuting and remote work.

Furthermore, the pandemic has markedly shifted consumer expectations towards more integrated, user-centric, and real-time mapping services. Digital map providers may need to prioritize enhancing their platforms with features such as augmented reality navigation, improved local business listings, and integration with health and safety information regarding travel and gatherings in urban areas. This adaptation will be crucial in rebuilding user trust and engagement in the post-pandemic landscape.

08 Porter's Five Forces Analysis

Bargaining Power of Suppliers
Bargaining Power of Buyers
Threat of New Entrants
Threat of Substitutes
Competitive Rivalry

Bargaining Power of Suppliers

The bargaining power of suppliers in the digital map market is a critical factor that shapes the competitive landscape. As technology advances, the number of suppliers offering technological solutions and data sources for digital mapping is growing. However, few of these suppliers hold significant leverage over established players due to the fragmented nature of the industry. Leading firms often develop proprietary technologies or data sourcing methods to mitigate supplier power, thereby limiting any potential monopolistic control.

Furthermore, the digital map market relies on a diverse array of suppliers, ranging from GPS hardware manufacturers to satellite imaging companies. This varied supply chain reduces the reliance on any single supplier, diminishing their power in negotiations. Established companies can easily switch providers or even bring facets of their supply chain in-house, diminishing the control suppliers typically exert in other markets.

However, as digital mapping evolves with increased accuracy and real-time data integration, suppliers providing unique and advanced technologies may experience an increase in their bargaining power. Supplier power is further heightened for companies that provide critical geospatial data that is not easily replicable. Firms that can offer specialized services or exclusive data have the upper hand in negotiating contracts and pricing.

The rise of technology partnerships and collaborations between digital mapping companies and their suppliers has also shifted the balance of power. Such relationships can create a mutual reliance that reduces supplier power but encourages innovation. Both parties benefit from joint research and development initiatives aimed at improving mapping accuracy and functionality, balancing their influence within the dynamic market.

In conclusion, while the bargaining power of suppliers in the digital map market is relatively moderate due to the broad range of suppliers and technologies available, it can increase with advancements in unique geospatial data capabilities and the establishment of strategic partnerships that drive innovation.

Bargaining Power of Buyers

The bargaining power of buyers in the digital map market is a significant aspect that influences pricing structures and product offerings. Buyers range from individual consumers to large corporations, government entities, and tech firms, which creates a mix of bargaining power levels. The diverse buyer demographic means that their needs can vary significantly, with larger organizations often demanding customized solutions that can increase their negotiating leverage.

As digital map technologies improve and more alternatives become available, buyers find themselves with more choices than ever. This abundance of options empowers them to seek better pricing and value, increasing their bargaining power. Particularly in business-to-business scenarios, where negotiations and bulk purchasing can lead to discounts, buyers can exert considerable pressure on suppliers to justify their pricing and offerings.

Another factor enhancing buyer power is the ease of access to information regarding available services and comparative pricing. With advanced consumer awareness facilitated by online platforms, buyers can easily assess multiple vendors, leading to increased pressure on suppliers to deliver more value or risk losing clients to competitors. This transparency further intensifies the competition among digital mapping service providers.

However, loyalty programs and the establishment of long-term service contracts can mitigate some of the bargaining power of buyers. Brands that successfully build a reputation for reliability and superior technology often enjoy higher customer retention rates, which can reduce the overall bargaining power of the buyers. Additionally, the integration of cutting-edge features that enhance user experience can create a preference for specific brands, thereby decreasing price sensitivity among devoted customers.

Ultimately, while the bargaining power of buyers in the digital map market is elevated due to the multiplicity of choices and information accessibility, effective branding and customer loyalty strategies can significantly counterbalance this power. This dynamic relationship highlights the importance of understanding buyer needs and response mechanisms in a competitive landscape.

Threat of New Entrants

The threat of new entrants in the digital map market reflects the overall health and competitiveness of the industry. The barriers to entry in this market can be categorized into several factors, including technological, regulatory, and resource-based constraints. On one hand, the rapid technological advancements and lowered costs of digital mapping tools have created a more accessible landscape for startups and new businesses. However, these same advancements also raise the bar for technological capabilities required to compete.

New entrants can leverage cloud technology, open-source software, and community-generated data to establish a foothold in the digital mapping domain. This decentralized approach allows for innovation at lower costs, which can potentially disrupt established firms. However, the dominant players with established networks, customer bases, and ample resources can respond quickly to competitive threats by innovating or adjusting their pricing strategies, thus raising the challenge for newcomers.

Furthermore, the significance of data in the digital mapping sphere cannot be overstated. Access to quality geospatial data is crucial for newcomers, and acquiring such data can be a complex and costly process due to existing contracts between established firms and data suppliers. Established companies hold substantial market share and control over essential data resources, creating a notable barrier that would-be entrants must overcome to gain a competitive edge.

Regulatory compliance also forms a significant hurdle for new players in the digital map market. As governments strive to regulate data privacy and accuracy, new entrants must invest time and money in understanding and conforming to these regulations. This requirement can delay entry and discourage potential participants from entering the market due to the increased operational complexities.

In conclusion, while there is a moderate threat of new entrants in the digital map market owing to technological advancements and a more open marketplace, substantial barriers in data acquisition, resource requirements, and regulatory challenges deter many potential new competitors. Established firms maintain a significant advantage that can protect their market share from new entrants.

Threat of Substitutes

The threat of substitutes in the digital map market presents considerable challenges for existing providers as alternatives continue to emerge. Substitutes can include various geographic information systems (GIS), paper maps, or even emerging technologies such as augmented reality (AR) mapping tools. As consumers become more tech-savvy, the demand for innovative solutions is increasing, leading to the rapid development of alternatives that can fulfill the same purpose as traditional digital maps.

GIS platforms may offer capabilities that go beyond the basic features provided by standard digital mapping services. For example, they can deliver robust analytical tools for businesses in logistics, urban planning, and environmental management. Such features enhance user value and that can result in customers opting for these substitutes over conventional digital maps, which may lack these advanced functionalities.

Furthermore, advancements in smartphone applications and navigation tools with integrated mapping capabilities can serve as substitutes to traditional digital maps. Many smartphone users rely on their devices for real-time navigation and location-based services, diminishing the demand for standalone digital mapping solutions. New applications utilizing artificial intelligence and machine learning are continuously emerging, offering more personalized and efficient mapping experiences that further challenge existing players to evolve.

Despite these changes, the digital map market enjoys certain competitive advantages that can mitigate the threat of substitutes. Established firms can focus on unique selling propositions such as superior data accuracy, integration with other services, and user-friendly interfaces that make their offerings more appealing compared to substitutes. They also have the capacity to invest in research and development to incorporate significant innovations that can stave off competition from substitutes.

In conclusion, while substitutes are increasingly prevalent in the digital mapping sector due to advancing technologies and changing consumer behaviors, established players can navigate this threat through innovation, enhanced functionalities, and leveraging their extensive data resources to maintain customer loyalty.

Competitive Rivalry

The competitive rivalry within the digital map market is intense and characterized by multiple players vying for market share. As both established firms and emerging startups strive for dominance, this competition drives innovation and fiercely impacts pricing strategies. Major companies such as Google, Apple, and Microsoft dominate the landscape, each leveraging their unique resources and technological capabilities to outpace competitors.

The entry of innovative startups equipped with advanced technologies and new approaches to mapping solutions further intensifies the rivalry. These companies often experiment with cutting-edge technology such as AI, machine learning, and augmented reality to offer differentiated products that challenge the status quo. Established players may find themselves not only competing on product features but also on providing seamless user experiences that incorporate the latest technology trends.

The vast scope of application for digital maps—from navigation and logistics to management and strategic planning—ensures that firms continuously seek to improve their services to meet a wide array of customer demands. This constant evolution and the need for differentiation create a hyper-competitive environment where companies must innovate or risk losing market share.

Furthermore, the race for partnerships and collaborations plays a crucial role in competitive rivalry. Companies are forging alliances with technology providers, data suppliers, and even regulatory entities to create more comprehensive solutions for their end users. These partnerships can yield significant competitive advantages, making collaboration a key tactical maneuver in the industry's escalating competition.

In conclusion, the competitive rivalry in the digital map market is characterized by intense competition that fosters continuous innovation and strategic partnerships. The need for firms to differentiate themselves in a rapidly evolving marketplace compels them to explore new technologies and innovate service offerings. This competitive landscape ensures that companies must stay agile and responsive to customer needs to maintain their market positions.

09 Key Insights and Findings

Market Overview
Key Trends
Challenges
Market Opportunities

Market Overview

The digital map market has experienced tremendous growth over the past few years, driven by advancements in technology and an increasing demand for location-based services. As urbanization continues to accelerate globally, the necessity for accurate and up-to-date geographic information has never been more critical. This increase in demand is reflected in the rising investments in technologies that enhance mapping capabilities, particularly in real-time data processing and high-resolution imagery.

The breadth of applications for digital maps also contributes to this market growth. Sectors such as transportation and logistics rely heavily on accurate mapping for route optimization and fleet management, while the tourism industry utilizes digital maps for user navigation and point-of-interest identification. Geographic Information Systems (GIS) play a crucial role in integrating various data types into comprehensible formats for businesses and governments, thereby widening the market's reach.

Moreover, the advent of smart devices equipped with GPS capabilities has further catalyzed the demand for digital mapping solutions. Users seeking convenience and efficient navigation have increasingly turned to applications powered by digital maps, such as ride-sharing and delivery services, spurring demand for sophisticated mapping technologies. Additionally, as mobile data and internet connectivity improve across the globe, more individuals gain access to these mapping services, increasing overall usage.

The competition within the digital map market is intensifying, with both established players and new entrants vying for market share. Companies are investing in innovative technologies, including machine learning and artificial intelligence, to enhance the accuracy and utility of their mapping solutions. Collaborative efforts among tech companies and traditional mapping firms are also shaping the market, leading to the creation of comprehensive mapping solutions that integrate various data types and offer advanced functionalities.

In summary, the digital map market is poised for continued expansion, driven by the need for accurate geographic information across multiple sectors and the integration of advanced technologies. As the landscape evolves, it will be crucial for stakeholders to remain agile and responsive to the ever-changing demands of users and technological advancements.

Key Trends

Several key trends are influencing the direction and growth of the digital map market. One prominent trend is the integration of augmented reality (AR) with digital mapping solutions. By overlaying digital information onto the real world, AR enhances user experiences, making navigation and geographic understanding much more intuitive. Companies are increasingly realizing the potential of AR in revolutionizing how users interact with maps, leading to partnerships and innovation in this area.

Another trend is the move towards open data policies, where governments and organizations are making geographic data publicly accessible. This trend supports the development of new mapping applications and encourages innovation by providing developers the necessary data to create unique solutions. As more open-source mapping tools emerge, businesses can leverage these resources to enhance their offerings without incurring substantial costs.

Moreover, the integration of Artificial Intelligence and Machine Learning technologies within digital mapping solutions is transforming the landscape. These technologies are enabling improved data analysis, predictive modeling, and enhanced user experiences. As a result, companies are investing significantly in AI-driven mapping products that can offer personalized and context-aware navigation services, catering to individual user needs more effectively.

The advent of autonomous vehicles is also shaping the digital map market. As vehicle automation advances, the demand for highly accurate and up-to-date maps increases. Autonomous vehicles rely on precise location data and dynamic routing capabilities to navigate successfully, driving investments in developing high-definition maps that cater specifically to this technological advancement. This creates an opportunity for map providers to innovate and create bespoke solutions tailored to the needs of autonomous technology.

Lastly, sustainability has become a critical focus area. More mapping providers are considering environmental impacts when developing solutions, promoting route optimization to reduce fuel consumption and carbon emissions. This trend aligns with global efforts toward sustainability, appealing to users who are increasingly environmentally conscious in their choices.

Challenges in the Digital Map Market

The digital map market, while burgeoning, faces several significant challenges that stakeholders must navigate to maintain sustainable growth. One of the foremost challenges is data privacy and security concerns. As mapping solutions increasingly rely on collecting user data to enhance services, regulatory scrutiny around data protection is intensifying. Failure to comply with regulations like GDPR can result in severe penalties and a loss of consumer trust, making it critical for companies to implement robust data management practices.

The rapidly evolving technological landscape also presents challenges as companies face constant pressure to innovate. Keeping up with the pace of technological advancement—such as the adoption of AI, AR, and IoT integrated solutions—requires significant investment in research and development, which can be a barrier for smaller firms or those with limited resources.

Moreover, the fragmentation of the digital map market can complicate matters. With numerous players offering varying levels of accuracy and services, consumers may find it difficult to choose the right solutions tailored to their specific needs. This fragmentation underscores the need for industry standards to enhance interoperability among different mapping platforms, which can ultimately benefit users seeking reliable data.

Competing with free mapping services provided by tech giants presents an additional challenge. Many consumers depend on these free services, which can make it challenging for mapping providers that charge for premium services to justify their pricing. Thus, demonstrating added value and superior functionality becomes paramount for businesses reliant on subscription models.

In conclusion, while there are considerable opportunities within the digital map market, organizations must address these challenges proactively to ensure compliance, maintain consumer confidence, and compete effectively. Creating innovative solutions while navigating regulatory landscapes will be critical to achieving long-term success in this dynamic environment.

Market Opportunities

The digital map market is ripe with opportunities as consumer demand for location-based services continues to grow. Among the most significant opportunities is the increased adoption of smart cities globally. Initiatives that incorporate intelligent infrastructure rely heavily on geographic data to optimize urban planning and resource management. Digital maps provide an essential backbone for such projects, enabling cities to monitor traffic, manage waste, and enhance public safety through real-time data analysis.

Additionally, there is a growing demand for personalized mapping services that cater specifically to individual user needs. Companies can leverage advanced analytics to create customized experiences, thus enhancing user engagement. The ability to understand user preferences and tailor map functionalities to various demographics presents a compelling opportunity for providers looking to differentiate their offerings in a crowded marketplace.

The collaboration between traditional map providers and technology firms represents another avenue for growth. By combining deep geographic knowledge with cutting-edge technologies, companies can create new mapping applications that address emerging needs, such as urban mobility solutions or smart logistics and delivery systems. Such collaborations can enhance market offerings and drive innovation.

Furthermore, the healthcare sector presents a niche market for digital mapping solutions. Accurate mapping can play a crucial role in crisis management, resource allocation, and accessibility assessments for healthcare services. For instance, during pandemics, digital maps can help track disease spread and allocate resources more effectively, making mapping solutions invaluable for public health.

Lastly, geographic analytics is gaining traction across various sectors, including retail and tourism. Businesses are increasingly using location intelligence to drive decision-making, from setting up new outlets to creating targeted marketing campaigns. This growing emphasis on geographic analytics allows mapping solution providers to expand their functionalities, offering richer data insights that can drive substantial business outcomes.

10 Digital Map Market - Technology Overview

Geographic Information System (GIS)
Global Positioning System (GPS)
Mapping Software Technologies
3D Mapping and Augmented Reality Technologies

Geographic Information System (GIS)

A Geographic Information System (GIS) is a framework for gathering, managing, and analyzing spatial and geographic data. GIS integrates various data sources, enabling users to visualize data in relation to geographic space. These systems allow industries to map complex relationships within data by providing tools that help in interpreting these spatial relationships. In many sectors, GIS has become indispensable for enhancing productivity through better knowledge management.

Modern GIS technology utilizes a wide range of data—ranging from satellite images to various types of socio-economic demographics. This data is processed using sophisticated algorithms and visualization tools, which enable organizations to make informed decisions based on the geographic implications of their operations. For example, city planners use GIS to visualize urban growth and plan infrastructure accordingly, while environmental agencies utilize these systems to monitor and manage natural resources efficiently.

The integration of machine learning and artificial intelligence within GIS is transforming the way geographic data is analyzed. These technologies enhance the ability of GIS to predict trends, manage risks, and optimize resource allocation. By automating routine analyses, organizations can focus on strategic decision-making rather than getting bogged down by data processing tasks. As a result, the inclusion of advanced analytics is making GIS systems more powerful and accessible to various users, including those with limited technical expertise.

In recent years, there has also been a shift towards cloud-based GIS solutions. Cloud computing allows for better collaboration among stakeholders by enabling real-time sharing and updating of geographic data. This democratization of technology means that even small organizations can access powerful GIS tools without the need for extensive in-house infrastructure. As more organizations recognize the benefits of cloud-based GIS, adoption rates continue to rise significantly, altering not just how maps are created, but also how they are utilized.

The ongoing evolution of GIS technology, driven by advancements in computing and data science, ensures that geographic analysis is becoming more sophisticated and integral to various disciplines. From urban planning to disaster management, GIS is evolving as a critical tool for managing the complexities of modern geography and facilitating a more data-driven approach to decision-making.

Global Positioning System (GPS)

The Global Positioning System (GPS) is a satellite-based navigation system that provides accurate location and time information anywhere on Earth. Initially developed for military applications, GPS technology has transcended its original purpose and is now a vital component of various consumer and commercial applications. GPS relies on a constellation of satellites that continuously transmit signals to GPS receivers, allowing users to precisely determine their location.

GPS technology operates on a principle called trilateration, which uses the time delay of signals received from multiple satellites to calculate the precise location of a GPS receiver. This technology has transformed sectors such as transportation, logistics, and personal navigation. From guiding delivery trucks to tracking personal fitness activities, GPS solutions have become essential in enhancing operational efficiencies and improving user experiences.

One notable trend in GPS technology is the improvement in accuracy and availability. Advances in satellite technology and augmentation systems have enhanced the capability of GPS, reducing error margins from large-scale measurements to mere centimeters. This precision is vital for applications such as autonomous vehicle navigation, where safety and reliability are paramount. The integration of GPS with other positioning systems, such as GLONASS and Galileo, further augments its capabilities, ensuring that users benefit from enhanced accuracy and connectivity.

Furthermore, GPS-based technologies are also finding innovative applications in agriculture through precision farming. Farmers use GPS to assess land and crop health, optimize field variability, and manage resources more sustainably. Smart farming systems, enabled by GPS technology, allow for increased productivity while minimizing environmental impact, showcasing the versatility of GPS in addressing global challenges.

As GPS technology continues to evolve, the potential for integration with emerging technologies such as Internet of Things (IoT) devices and automated machinery expands. The fusion of GPS with IoT can lead to smarter cities, enhanced public safety measures, and improved logistics and supply chain management, demonstrating how GPS plays a pivotal role in shaping the future of connectivity in technology-driven landscapes.

Mapping Software Technologies

Mapping software technologies encompass platforms and applications designed to create, edit, and visualize spatial data. These technologies have democratized access to mapping tools, allowing businesses and individuals to harness the power of geographic data without requiring advanced technical skills. The tools range from simple online map services to sophisticated Geographic Information System (GIS) software that provide comprehensive functionality for spatial analysis.

Modern mapping software has moved beyond traditional functions, integrating a suite of analytical features that enable users to visualize patterns, trends, and relationships within their data. For instance, heat maps, 3D visualizations, and dynamic storytelling tools are designed to enhance understanding and communication of complex spatial information. This enhanced functionality is beneficial in various fields, such as urban planning, environmental science, and marketing, where geographic context is crucial for strategic decision-making.

The rise of cloud computing has also transformed mapping software technologies, making high-quality mapping solutions more accessible. Cloud-based platforms allow for real-time collaboration, enabling multiple users to edit and analyze mapping data simultaneously. This shift is particularly advantageous for teams working on projects that require input from diverse stakeholders, allowing for greater efficiency and accuracy in capturing geographic phenomena.

Furthermore, advancements in user interface design have made mapping software more intuitive and user-friendly. This shift empowers non-technical users to engage with mapping technologies, facilitating better data use across organizations. The ability to customize and personalize mapping projects enhances user engagement and leads to more productive outcomes as various stakeholders can visualize the data relevant to their specific needs.

As businesses recognize the strategic value of spatial data, the demand for sophisticated mapping software technologies will continue to grow. The ongoing research and development in this field will likely lead to improved features such as integrated artificial intelligence for predictive analysis and enhanced real-time data visualization capabilities, ensuring mapping software remains a cornerstone in the GIS landscape.

3D Mapping and Augmented Reality Technologies

3D mapping and augmented reality (AR) technologies are at the forefront of transforming how we interact with geographic data. By enabling users to visualize data in a three-dimensional space, these technologies enhance understanding and engagement with complex spatial information. 3D mapping provides a more realistic representation of terrain, architecture, and urban environments, making it essential for applications ranging from real estate development to environmental monitoring.

AR takes the concept of mapping a step further by integrating virtual elements into the real world through devices such as smartphones and AR glasses. This technology overlays digital information onto physical environments, offering users unique and interactive experiences. For instance, AR applications can guide users through historical sites by displaying dynamic information about landmarks directly in their field of view, enriching the learning experience and enhancing user interaction.

In construction and engineering, 3D mapping technologies facilitate better planning and execution of projects. With accurate 3D representations of construction sites, project managers can identify potential challenges before they arise, optimize workflows, and enhance collaboration among teams. This proactive approach reduces costs, mitigates risks, and ensures that projects stay on track, showcasing the business value of incorporating advanced mapping technologies into operational frameworks.

The gaming industry also harnesses the potential of AR and 3D mapping technologies, creating immersive experiences that attract users' interest. The popularity of location-based games has demonstrated how geographic context can enhance user engagement and interactivity, providing a model for other businesses to explore similar strategies in leveraging geographic data.

As we move forward, the synergy between 3D mapping and augmented reality is poised to create even more transformational applications across various sectors. Industries such as healthcare, tourism, and education will benefit from these technologies, leading to innovative solutions that address specific challenges and enhance overall user experiences. The future of the digital map market will likely be shaped by the continued investment in and development of these advanced mapping technologies, driving both creative applications and practical implementations.

11 Digital Map Market, By Product

GLOBAL ARTIFICIAL INTELLIGENCE MARKET SIZE, BY PRODUCT, 2023-2030 (USD BILLION)

By Product20232024202520262027202820292030CAGR (2023-2030)
Forecast
Softwarexxxxxxxxxxxxxxxxxx
Hardwarexxxxxxxxxxxxxxxxxx
Servicesxxxxxxxxxxxxxxxxxx
Source: Secondary Research, Expert Interviews, and CONSAINSIGHTS Analysis

GLOBAL ARTIFICIAL INTELLIGENCE MARKET SIZE, BY SOFTWARE, 2023-2030 (USD BILLION)

Software20232024202520262027202820292030CAGR (2023-2030)
Forecast
Mapping Softwarexxxxxxxxxxxxxxxxxx
Navigation Softwarexxxxxxxxxxxxxxxxxx
Geo-analytics Softwarexxxxxxxxxxxxxxxxxx
Source: Secondary Research, Expert Interviews, and CONSAINSIGHTS Analysis

GLOBAL ARTIFICIAL INTELLIGENCE MARKET SIZE, BY HARDWARE, 2023-2030 (USD BILLION)

Hardware20232024202520262027202820292030CAGR (2023-2030)
Forecast
Mapping Devicesxxxxxxxxxxxxxxxxxx
GPS Devicesxxxxxxxxxxxxxxxxxx
Drones for Mappingxxxxxxxxxxxxxxxxxx
Source: Secondary Research, Expert Interviews, and CONSAINSIGHTS Analysis

GLOBAL ARTIFICIAL INTELLIGENCE MARKET SIZE, BY SERVICES, 2023-2030 (USD BILLION)

Services20232024202520262027202820292030CAGR (2023-2030)
Forecast
Consulting Servicesxxxxxxxxxxxxxxxxxx
Mapping and Analysis Servicesxxxxxxxxxxxxxxxxxx
Maintenance and Support Servicesxxxxxxxxxxxxxxxxxx
Source: Secondary Research, Expert Interviews, and CONSAINSIGHTS Analysis

12 Digital Map Market, By Application

GLOBAL ARTIFICIAL INTELLIGENCE MARKET SIZE, BY APPLICATION, 2023-2030 (USD BILLION)

By Application20232024202520262027202820292030CAGR (2023-2030)
Forecast
Transportationxxxxxxxxxxxxxxxxxx
Urban Planningxxxxxxxxxxxxxxxxxx
Real Estatexxxxxxxxxxxxxxxxxx
Disaster Managementxxxxxxxxxxxxxxxxxx
Agriculturexxxxxxxxxxxxxxxxxx
Tourismxxxxxxxxxxxxxxxxxx
Other Applicationsxxxxxxxxxxxxxxxxxx
Source: Secondary Research, Expert Interviews, and CONSAINSIGHTS Analysis

13 Digital Map Market, By Deployment Mode

0

14 Digital Map Market, By End-User Industry Overview

0

15 By Region

NORTH AMERICA ARTIFICIAL INTELLIGENCE MARKET SIZE, BY PRODUCT, 2023-2030 (USD BILLION)

By Product20232024202520262027202820292030CAGR (2023-2030)
Forecast
Softwarexxxxxxxxxxxxxxxxxx
Hardwarexxxxxxxxxxxxxxxxxx
Servicesxxxxxxxxxxxxxxxxxx
Source: Secondary Research, Expert Interviews, and CONSAINSIGHTS Analysis

NORTH AMERICA ARTIFICIAL INTELLIGENCE MARKET SIZE, BY SOFTWARE, 2023-2030 (USD BILLION)

Software20232024202520262027202820292030CAGR (2023-2030)
Forecast
Mapping Softwarexxxxxxxxxxxxxxxxxx
Navigation Softwarexxxxxxxxxxxxxxxxxx
Geo-analytics Softwarexxxxxxxxxxxxxxxxxx
Source: Secondary Research, Expert Interviews, and CONSAINSIGHTS Analysis

NORTH AMERICA ARTIFICIAL INTELLIGENCE MARKET SIZE, BY PRODUCT, 2023-2030 (USD BILLION)

By Product20232024202520262027202820292030CAGR (2023-2030)
Forecast
Softwarexxxxxxxxxxxxxxxxxx
Hardwarexxxxxxxxxxxxxxxxxx
Servicesxxxxxxxxxxxxxxxxxx
Source: Secondary Research, Expert Interviews, and CONSAINSIGHTS Analysis

NORTH AMERICA ARTIFICIAL INTELLIGENCE MARKET SIZE, BY HARDWARE, 2023-2030 (USD BILLION)

Hardware20232024202520262027202820292030CAGR (2023-2030)
Forecast
Mapping Devicesxxxxxxxxxxxxxxxxxx
GPS Devicesxxxxxxxxxxxxxxxxxx
Drones for Mappingxxxxxxxxxxxxxxxxxx
Source: Secondary Research, Expert Interviews, and CONSAINSIGHTS Analysis

NORTH AMERICA ARTIFICIAL INTELLIGENCE MARKET SIZE, BY PRODUCT, 2023-2030 (USD BILLION)

By Product20232024202520262027202820292030CAGR (2023-2030)
Forecast
Softwarexxxxxxxxxxxxxxxxxx
Hardwarexxxxxxxxxxxxxxxxxx
Servicesxxxxxxxxxxxxxxxxxx
Source: Secondary Research, Expert Interviews, and CONSAINSIGHTS Analysis

NORTH AMERICA ARTIFICIAL INTELLIGENCE MARKET SIZE, BY SERVICES, 2023-2030 (USD BILLION)

Services20232024202520262027202820292030CAGR (2023-2030)
Forecast
Consulting Servicesxxxxxxxxxxxxxxxxxx
Mapping and Analysis Servicesxxxxxxxxxxxxxxxxxx
Maintenance and Support Servicesxxxxxxxxxxxxxxxxxx
Source: Secondary Research, Expert Interviews, and CONSAINSIGHTS Analysis

NORTH AMERICA ARTIFICIAL INTELLIGENCE MARKET SIZE, BY APPLICATION, 2023-2030 (USD BILLION)

By Application20232024202520262027202820292030CAGR (2023-2030)
Forecast
Transportationxxxxxxxxxxxxxxxxxx
Urban Planningxxxxxxxxxxxxxxxxxx
Real Estatexxxxxxxxxxxxxxxxxx
Disaster Managementxxxxxxxxxxxxxxxxxx
Agriculturexxxxxxxxxxxxxxxxxx
Tourismxxxxxxxxxxxxxxxxxx
Other Applicationsxxxxxxxxxxxxxxxxxx
Source: Secondary Research, Expert Interviews, and CONSAINSIGHTS Analysis

USA ARTIFICIAL INTELLIGENCE MARKET SIZE, BY PRODUCT, 2023-2030 (USD BILLION)

By Product20232024202520262027202820292030CAGR (2023-2030)
Forecast
Softwarexxxxxxxxxxxxxxxxxx
Hardwarexxxxxxxxxxxxxxxxxx
Servicesxxxxxxxxxxxxxxxxxx
Source: Secondary Research, Expert Interviews, and CONSAINSIGHTS Analysis

USA ARTIFICIAL INTELLIGENCE MARKET SIZE, BY SOFTWARE, 2023-2030 (USD BILLION)

Software20232024202520262027202820292030CAGR (2023-2030)
Forecast
Mapping Softwarexxxxxxxxxxxxxxxxxx
Navigation Softwarexxxxxxxxxxxxxxxxxx
Geo-analytics Softwarexxxxxxxxxxxxxxxxxx
Source: Secondary Research, Expert Interviews, and CONSAINSIGHTS Analysis

USA ARTIFICIAL INTELLIGENCE MARKET SIZE, BY PRODUCT, 2023-2030 (USD BILLION)

By Product20232024202520262027202820292030CAGR (2023-2030)
Forecast
Softwarexxxxxxxxxxxxxxxxxx
Hardwarexxxxxxxxxxxxxxxxxx
Servicesxxxxxxxxxxxxxxxxxx
Source: Secondary Research, Expert Interviews, and CONSAINSIGHTS Analysis

USA ARTIFICIAL INTELLIGENCE MARKET SIZE, BY HARDWARE, 2023-2030 (USD BILLION)

Hardware20232024202520262027202820292030CAGR (2023-2030)
Forecast
Mapping Devicesxxxxxxxxxxxxxxxxxx
GPS Devicesxxxxxxxxxxxxxxxxxx
Drones for Mappingxxxxxxxxxxxxxxxxxx
Source: Secondary Research, Expert Interviews, and CONSAINSIGHTS Analysis

USA ARTIFICIAL INTELLIGENCE MARKET SIZE, BY PRODUCT, 2023-2030 (USD BILLION)

By Product20232024202520262027202820292030CAGR (2023-2030)
Forecast
Softwarexxxxxxxxxxxxxxxxxx
Hardwarexxxxxxxxxxxxxxxxxx
Servicesxxxxxxxxxxxxxxxxxx
Source: Secondary Research, Expert Interviews, and CONSAINSIGHTS Analysis

USA ARTIFICIAL INTELLIGENCE MARKET SIZE, BY SERVICES, 2023-2030 (USD BILLION)

Services20232024202520262027202820292030CAGR (2023-2030)
Forecast
Consulting Servicesxxxxxxxxxxxxxxxxxx
Mapping and Analysis Servicesxxxxxxxxxxxxxxxxxx
Maintenance and Support Servicesxxxxxxxxxxxxxxxxxx
Source: Secondary Research, Expert Interviews, and CONSAINSIGHTS Analysis

USA ARTIFICIAL INTELLIGENCE MARKET SIZE, BY APPLICATION, 2023-2030 (USD BILLION)

By Application20232024202520262027202820292030CAGR (2023-2030)
Forecast
Transportationxxxxxxxxxxxxxxxxxx
Urban Planningxxxxxxxxxxxxxxxxxx
Real Estatexxxxxxxxxxxxxxxxxx
Disaster Managementxxxxxxxxxxxxxxxxxx
Agriculturexxxxxxxxxxxxxxxxxx
Tourismxxxxxxxxxxxxxxxxxx
Other Applicationsxxxxxxxxxxxxxxxxxx
Source: Secondary Research, Expert Interviews, and CONSAINSIGHTS Analysis

CANADA ARTIFICIAL INTELLIGENCE MARKET SIZE, BY PRODUCT, 2023-2030 (USD BILLION)

By Product20232024202520262027202820292030CAGR (2023-2030)
Forecast
Softwarexxxxxxxxxxxxxxxxxx
Hardwarexxxxxxxxxxxxxxxxxx
Servicesxxxxxxxxxxxxxxxxxx
Source: Secondary Research, Expert Interviews, and CONSAINSIGHTS Analysis

CANADA ARTIFICIAL INTELLIGENCE MARKET SIZE, BY SOFTWARE, 2023-2030 (USD BILLION)

Software20232024202520262027202820292030CAGR (2023-2030)
Forecast
Mapping Softwarexxxxxxxxxxxxxxxxxx
Navigation Softwarexxxxxxxxxxxxxxxxxx
Geo-analytics Softwarexxxxxxxxxxxxxxxxxx
Source: Secondary Research, Expert Interviews, and CONSAINSIGHTS Analysis

CANADA ARTIFICIAL INTELLIGENCE MARKET SIZE, BY PRODUCT, 2023-2030 (USD BILLION)

By Product20232024202520262027202820292030CAGR (2023-2030)
Forecast
Softwarexxxxxxxxxxxxxxxxxx
Hardwarexxxxxxxxxxxxxxxxxx
Servicesxxxxxxxxxxxxxxxxxx
Source: Secondary Research, Expert Interviews, and CONSAINSIGHTS Analysis

CANADA ARTIFICIAL INTELLIGENCE MARKET SIZE, BY HARDWARE, 2023-2030 (USD BILLION)

Hardware20232024202520262027202820292030CAGR (2023-2030)
Forecast
Mapping Devicesxxxxxxxxxxxxxxxxxx
GPS Devicesxxxxxxxxxxxxxxxxxx
Drones for Mappingxxxxxxxxxxxxxxxxxx
Source: Secondary Research, Expert Interviews, and CONSAINSIGHTS Analysis

CANADA ARTIFICIAL INTELLIGENCE MARKET SIZE, BY PRODUCT, 2023-2030 (USD BILLION)

By Product20232024202520262027202820292030CAGR (2023-2030)
Forecast
Softwarexxxxxxxxxxxxxxxxxx
Hardwarexxxxxxxxxxxxxxxxxx
Servicesxxxxxxxxxxxxxxxxxx
Source: Secondary Research, Expert Interviews, and CONSAINSIGHTS Analysis

CANADA ARTIFICIAL INTELLIGENCE MARKET SIZE, BY SERVICES, 2023-2030 (USD BILLION)

Services20232024202520262027202820292030CAGR (2023-2030)
Forecast
Consulting Servicesxxxxxxxxxxxxxxxxxx
Mapping and Analysis Servicesxxxxxxxxxxxxxxxxxx
Maintenance and Support Servicesxxxxxxxxxxxxxxxxxx
Source: Secondary Research, Expert Interviews, and CONSAINSIGHTS Analysis

CANADA ARTIFICIAL INTELLIGENCE MARKET SIZE, BY APPLICATION, 2023-2030 (USD BILLION)

By Application20232024202520262027202820292030CAGR (2023-2030)
Forecast
Transportationxxxxxxxxxxxxxxxxxx
Urban Planningxxxxxxxxxxxxxxxxxx
Real Estatexxxxxxxxxxxxxxxxxx
Disaster Managementxxxxxxxxxxxxxxxxxx
Agriculturexxxxxxxxxxxxxxxxxx
Tourismxxxxxxxxxxxxxxxxxx
Other Applicationsxxxxxxxxxxxxxxxxxx
Source: Secondary Research, Expert Interviews, and CONSAINSIGHTS Analysis

MEXICO ARTIFICIAL INTELLIGENCE MARKET SIZE, BY PRODUCT, 2023-2030 (USD BILLION)

By Product20232024202520262027202820292030CAGR (2023-2030)
Forecast
Softwarexxxxxxxxxxxxxxxxxx
Hardwarexxxxxxxxxxxxxxxxxx
Servicesxxxxxxxxxxxxxxxxxx
Source: Secondary Research, Expert Interviews, and CONSAINSIGHTS Analysis

MEXICO ARTIFICIAL INTELLIGENCE MARKET SIZE, BY SOFTWARE, 2023-2030 (USD BILLION)

Software20232024202520262027202820292030CAGR (2023-2030)
Forecast
Mapping Softwarexxxxxxxxxxxxxxxxxx
Navigation Softwarexxxxxxxxxxxxxxxxxx
Geo-analytics Softwarexxxxxxxxxxxxxxxxxx
Source: Secondary Research, Expert Interviews, and CONSAINSIGHTS Analysis

MEXICO ARTIFICIAL INTELLIGENCE MARKET SIZE, BY PRODUCT, 2023-2030 (USD BILLION)

By Product20232024202520262027202820292030CAGR (2023-2030)
Forecast
Softwarexxxxxxxxxxxxxxxxxx
Hardwarexxxxxxxxxxxxxxxxxx
Servicesxxxxxxxxxxxxxxxxxx
Source: Secondary Research, Expert Interviews, and CONSAINSIGHTS Analysis

MEXICO ARTIFICIAL INTELLIGENCE MARKET SIZE, BY HARDWARE, 2023-2030 (USD BILLION)

Hardware20232024202520262027202820292030CAGR (2023-2030)
Forecast
Mapping Devicesxxxxxxxxxxxxxxxxxx
GPS Devicesxxxxxxxxxxxxxxxxxx
Drones for Mappingxxxxxxxxxxxxxxxxxx
Source: Secondary Research, Expert Interviews, and CONSAINSIGHTS Analysis

MEXICO ARTIFICIAL INTELLIGENCE MARKET SIZE, BY PRODUCT, 2023-2030 (USD BILLION)

By Product20232024202520262027202820292030CAGR (2023-2030)
Forecast
Softwarexxxxxxxxxxxxxxxxxx
Hardwarexxxxxxxxxxxxxxxxxx
Servicesxxxxxxxxxxxxxxxxxx
Source: Secondary Research, Expert Interviews, and CONSAINSIGHTS Analysis

MEXICO ARTIFICIAL INTELLIGENCE MARKET SIZE, BY SERVICES, 2023-2030 (USD BILLION)

Services20232024202520262027202820292030CAGR (2023-2030)
Forecast
Consulting Servicesxxxxxxxxxxxxxxxxxx
Mapping and Analysis Servicesxxxxxxxxxxxxxxxxxx
Maintenance and Support Servicesxxxxxxxxxxxxxxxxxx
Source: Secondary Research, Expert Interviews, and CONSAINSIGHTS Analysis

MEXICO ARTIFICIAL INTELLIGENCE MARKET SIZE, BY APPLICATION, 2023-2030 (USD BILLION)

By Application20232024202520262027202820292030CAGR (2023-2030)
Forecast
Transportationxxxxxxxxxxxxxxxxxx
Urban Planningxxxxxxxxxxxxxxxxxx
Real Estatexxxxxxxxxxxxxxxxxx
Disaster Managementxxxxxxxxxxxxxxxxxx
Agriculturexxxxxxxxxxxxxxxxxx
Tourismxxxxxxxxxxxxxxxxxx
Other Applicationsxxxxxxxxxxxxxxxxxx
Source: Secondary Research, Expert Interviews, and CONSAINSIGHTS Analysis

EUROPE ARTIFICIAL INTELLIGENCE MARKET SIZE, BY PRODUCT, 2023-2030 (USD BILLION)

By Product20232024202520262027202820292030CAGR (2023-2030)
Forecast
Softwarexxxxxxxxxxxxxxxxxx
Hardwarexxxxxxxxxxxxxxxxxx
Servicesxxxxxxxxxxxxxxxxxx
Source: Secondary Research, Expert Interviews, and CONSAINSIGHTS Analysis

EUROPE ARTIFICIAL INTELLIGENCE MARKET SIZE, BY SOFTWARE, 2023-2030 (USD BILLION)

Software20232024202520262027202820292030CAGR (2023-2030)
Forecast
Mapping Softwarexxxxxxxxxxxxxxxxxx
Navigation Softwarexxxxxxxxxxxxxxxxxx
Geo-analytics Softwarexxxxxxxxxxxxxxxxxx
Source: Secondary Research, Expert Interviews, and CONSAINSIGHTS Analysis

EUROPE ARTIFICIAL INTELLIGENCE MARKET SIZE, BY PRODUCT, 2023-2030 (USD BILLION)

By Product20232024202520262027202820292030CAGR (2023-2030)
Forecast
Softwarexxxxxxxxxxxxxxxxxx
Hardwarexxxxxxxxxxxxxxxxxx
Servicesxxxxxxxxxxxxxxxxxx
Source: Secondary Research, Expert Interviews, and CONSAINSIGHTS Analysis

EUROPE ARTIFICIAL INTELLIGENCE MARKET SIZE, BY HARDWARE, 2023-2030 (USD BILLION)

Hardware20232024202520262027202820292030CAGR (2023-2030)
Forecast
Mapping Devicesxxxxxxxxxxxxxxxxxx
GPS Devicesxxxxxxxxxxxxxxxxxx
Drones for Mappingxxxxxxxxxxxxxxxxxx
Source: Secondary Research, Expert Interviews, and CONSAINSIGHTS Analysis

EUROPE ARTIFICIAL INTELLIGENCE MARKET SIZE, BY PRODUCT, 2023-2030 (USD BILLION)

By Product20232024202520262027202820292030CAGR (2023-2030)
Forecast
Softwarexxxxxxxxxxxxxxxxxx
Hardwarexxxxxxxxxxxxxxxxxx
Servicesxxxxxxxxxxxxxxxxxx
Source: Secondary Research, Expert Interviews, and CONSAINSIGHTS Analysis

EUROPE ARTIFICIAL INTELLIGENCE MARKET SIZE, BY SERVICES, 2023-2030 (USD BILLION)

Services20232024202520262027202820292030CAGR (2023-2030)
Forecast
Consulting Servicesxxxxxxxxxxxxxxxxxx
Mapping and Analysis Servicesxxxxxxxxxxxxxxxxxx
Maintenance and Support Servicesxxxxxxxxxxxxxxxxxx
Source: Secondary Research, Expert Interviews, and CONSAINSIGHTS Analysis

EUROPE ARTIFICIAL INTELLIGENCE MARKET SIZE, BY APPLICATION, 2023-2030 (USD BILLION)

By Application20232024202520262027202820292030CAGR (2023-2030)
Forecast
Transportationxxxxxxxxxxxxxxxxxx
Urban Planningxxxxxxxxxxxxxxxxxx
Real Estatexxxxxxxxxxxxxxxxxx
Disaster Managementxxxxxxxxxxxxxxxxxx
Agriculturexxxxxxxxxxxxxxxxxx
Tourismxxxxxxxxxxxxxxxxxx
Other Applicationsxxxxxxxxxxxxxxxxxx
Source: Secondary Research, Expert Interviews, and CONSAINSIGHTS Analysis

GERMANY ARTIFICIAL INTELLIGENCE MARKET SIZE, BY PRODUCT, 2023-2030 (USD BILLION)

By Product20232024202520262027202820292030CAGR (2023-2030)
Forecast
Softwarexxxxxxxxxxxxxxxxxx
Hardwarexxxxxxxxxxxxxxxxxx
Servicesxxxxxxxxxxxxxxxxxx
Source: Secondary Research, Expert Interviews, and CONSAINSIGHTS Analysis

GERMANY ARTIFICIAL INTELLIGENCE MARKET SIZE, BY SOFTWARE, 2023-2030 (USD BILLION)

Software20232024202520262027202820292030CAGR (2023-2030)
Forecast
Mapping Softwarexxxxxxxxxxxxxxxxxx
Navigation Softwarexxxxxxxxxxxxxxxxxx
Geo-analytics Softwarexxxxxxxxxxxxxxxxxx
Source: Secondary Research, Expert Interviews, and CONSAINSIGHTS Analysis

GERMANY ARTIFICIAL INTELLIGENCE MARKET SIZE, BY PRODUCT, 2023-2030 (USD BILLION)

By Product20232024202520262027202820292030CAGR (2023-2030)
Forecast
Softwarexxxxxxxxxxxxxxxxxx
Hardwarexxxxxxxxxxxxxxxxxx
Servicesxxxxxxxxxxxxxxxxxx
Source: Secondary Research, Expert Interviews, and CONSAINSIGHTS Analysis

GERMANY ARTIFICIAL INTELLIGENCE MARKET SIZE, BY HARDWARE, 2023-2030 (USD BILLION)

Hardware20232024202520262027202820292030CAGR (2023-2030)
Forecast
Mapping Devicesxxxxxxxxxxxxxxxxxx
GPS Devicesxxxxxxxxxxxxxxxxxx
Drones for Mappingxxxxxxxxxxxxxxxxxx
Source: Secondary Research, Expert Interviews, and CONSAINSIGHTS Analysis

GERMANY ARTIFICIAL INTELLIGENCE MARKET SIZE, BY PRODUCT, 2023-2030 (USD BILLION)

By Product20232024202520262027202820292030CAGR (2023-2030)
Forecast
Softwarexxxxxxxxxxxxxxxxxx
Hardwarexxxxxxxxxxxxxxxxxx
Servicesxxxxxxxxxxxxxxxxxx
Source: Secondary Research, Expert Interviews, and CONSAINSIGHTS Analysis

GERMANY ARTIFICIAL INTELLIGENCE MARKET SIZE, BY SERVICES, 2023-2030 (USD BILLION)

Services20232024202520262027202820292030CAGR (2023-2030)
Forecast
Consulting Servicesxxxxxxxxxxxxxxxxxx
Mapping and Analysis Servicesxxxxxxxxxxxxxxxxxx
Maintenance and Support Servicesxxxxxxxxxxxxxxxxxx
Source: Secondary Research, Expert Interviews, and CONSAINSIGHTS Analysis

GERMANY ARTIFICIAL INTELLIGENCE MARKET SIZE, BY APPLICATION, 2023-2030 (USD BILLION)

By Application20232024202520262027202820292030CAGR (2023-2030)
Forecast
Transportationxxxxxxxxxxxxxxxxxx
Urban Planningxxxxxxxxxxxxxxxxxx
Real Estatexxxxxxxxxxxxxxxxxx
Disaster Managementxxxxxxxxxxxxxxxxxx
Agriculturexxxxxxxxxxxxxxxxxx
Tourismxxxxxxxxxxxxxxxxxx
Other Applicationsxxxxxxxxxxxxxxxxxx
Source: Secondary Research, Expert Interviews, and CONSAINSIGHTS Analysis

UK ARTIFICIAL INTELLIGENCE MARKET SIZE, BY PRODUCT, 2023-2030 (USD BILLION)

By Product20232024202520262027202820292030CAGR (2023-2030)
Forecast
Softwarexxxxxxxxxxxxxxxxxx
Hardwarexxxxxxxxxxxxxxxxxx
Servicesxxxxxxxxxxxxxxxxxx
Source: Secondary Research, Expert Interviews, and CONSAINSIGHTS Analysis

UK ARTIFICIAL INTELLIGENCE MARKET SIZE, BY SOFTWARE, 2023-2030 (USD BILLION)

Software20232024202520262027202820292030CAGR (2023-2030)
Forecast
Mapping Softwarexxxxxxxxxxxxxxxxxx
Navigation Softwarexxxxxxxxxxxxxxxxxx
Geo-analytics Softwarexxxxxxxxxxxxxxxxxx
Source: Secondary Research, Expert Interviews, and CONSAINSIGHTS Analysis

UK ARTIFICIAL INTELLIGENCE MARKET SIZE, BY PRODUCT, 2023-2030 (USD BILLION)

By Product20232024202520262027202820292030CAGR (2023-2030)
Forecast
Softwarexxxxxxxxxxxxxxxxxx
Hardwarexxxxxxxxxxxxxxxxxx
Servicesxxxxxxxxxxxxxxxxxx
Source: Secondary Research, Expert Interviews, and CONSAINSIGHTS Analysis

UK ARTIFICIAL INTELLIGENCE MARKET SIZE, BY HARDWARE, 2023-2030 (USD BILLION)

Hardware20232024202520262027202820292030CAGR (2023-2030)
Forecast
Mapping Devicesxxxxxxxxxxxxxxxxxx
GPS Devicesxxxxxxxxxxxxxxxxxx
Drones for Mappingxxxxxxxxxxxxxxxxxx
Source: Secondary Research, Expert Interviews, and CONSAINSIGHTS Analysis

UK ARTIFICIAL INTELLIGENCE MARKET SIZE, BY PRODUCT, 2023-2030 (USD BILLION)

By Product20232024202520262027202820292030CAGR (2023-2030)
Forecast
Softwarexxxxxxxxxxxxxxxxxx
Hardwarexxxxxxxxxxxxxxxxxx
Servicesxxxxxxxxxxxxxxxxxx
Source: Secondary Research, Expert Interviews, and CONSAINSIGHTS Analysis

UK ARTIFICIAL INTELLIGENCE MARKET SIZE, BY SERVICES, 2023-2030 (USD BILLION)

Services20232024202520262027202820292030CAGR (2023-2030)
Forecast
Consulting Servicesxxxxxxxxxxxxxxxxxx
Mapping and Analysis Servicesxxxxxxxxxxxxxxxxxx
Maintenance and Support Servicesxxxxxxxxxxxxxxxxxx
Source: Secondary Research, Expert Interviews, and CONSAINSIGHTS Analysis

UK ARTIFICIAL INTELLIGENCE MARKET SIZE, BY APPLICATION, 2023-2030 (USD BILLION)

By Application20232024202520262027202820292030CAGR (2023-2030)
Forecast
Transportationxxxxxxxxxxxxxxxxxx
Urban Planningxxxxxxxxxxxxxxxxxx
Real Estatexxxxxxxxxxxxxxxxxx
Disaster Managementxxxxxxxxxxxxxxxxxx
Agriculturexxxxxxxxxxxxxxxxxx
Tourismxxxxxxxxxxxxxxxxxx
Other Applicationsxxxxxxxxxxxxxxxxxx
Source: Secondary Research, Expert Interviews, and CONSAINSIGHTS Analysis

FRANCE ARTIFICIAL INTELLIGENCE MARKET SIZE, BY PRODUCT, 2023-2030 (USD BILLION)

By Product20232024202520262027202820292030CAGR (2023-2030)
Forecast
Softwarexxxxxxxxxxxxxxxxxx
Hardwarexxxxxxxxxxxxxxxxxx
Servicesxxxxxxxxxxxxxxxxxx
Source: Secondary Research, Expert Interviews, and CONSAINSIGHTS Analysis

FRANCE ARTIFICIAL INTELLIGENCE MARKET SIZE, BY SOFTWARE, 2023-2030 (USD BILLION)

Software20232024202520262027202820292030CAGR (2023-2030)
Forecast
Mapping Softwarexxxxxxxxxxxxxxxxxx
Navigation Softwarexxxxxxxxxxxxxxxxxx
Geo-analytics Softwarexxxxxxxxxxxxxxxxxx
Source: Secondary Research, Expert Interviews, and CONSAINSIGHTS Analysis

FRANCE ARTIFICIAL INTELLIGENCE MARKET SIZE, BY PRODUCT, 2023-2030 (USD BILLION)

By Product20232024202520262027202820292030CAGR (2023-2030)
Forecast
Softwarexxxxxxxxxxxxxxxxxx
Hardwarexxxxxxxxxxxxxxxxxx
Servicesxxxxxxxxxxxxxxxxxx
Source: Secondary Research, Expert Interviews, and CONSAINSIGHTS Analysis

FRANCE ARTIFICIAL INTELLIGENCE MARKET SIZE, BY HARDWARE, 2023-2030 (USD BILLION)

Hardware20232024202520262027202820292030CAGR (2023-2030)
Forecast
Mapping Devicesxxxxxxxxxxxxxxxxxx
GPS Devicesxxxxxxxxxxxxxxxxxx
Drones for Mappingxxxxxxxxxxxxxxxxxx
Source: Secondary Research, Expert Interviews, and CONSAINSIGHTS Analysis

FRANCE ARTIFICIAL INTELLIGENCE MARKET SIZE, BY PRODUCT, 2023-2030 (USD BILLION)

By Product20232024202520262027202820292030CAGR (2023-2030)
Forecast
Softwarexxxxxxxxxxxxxxxxxx
Hardwarexxxxxxxxxxxxxxxxxx
Servicesxxxxxxxxxxxxxxxxxx
Source: Secondary Research, Expert Interviews, and CONSAINSIGHTS Analysis

FRANCE ARTIFICIAL INTELLIGENCE MARKET SIZE, BY SERVICES, 2023-2030 (USD BILLION)

Services20232024202520262027202820292030CAGR (2023-2030)
Forecast
Consulting Servicesxxxxxxxxxxxxxxxxxx
Mapping and Analysis Servicesxxxxxxxxxxxxxxxxxx
Maintenance and Support Servicesxxxxxxxxxxxxxxxxxx
Source: Secondary Research, Expert Interviews, and CONSAINSIGHTS Analysis

FRANCE ARTIFICIAL INTELLIGENCE MARKET SIZE, BY APPLICATION, 2023-2030 (USD BILLION)

By Application20232024202520262027202820292030CAGR (2023-2030)
Forecast
Transportationxxxxxxxxxxxxxxxxxx
Urban Planningxxxxxxxxxxxxxxxxxx
Real Estatexxxxxxxxxxxxxxxxxx
Disaster Managementxxxxxxxxxxxxxxxxxx
Agriculturexxxxxxxxxxxxxxxxxx
Tourismxxxxxxxxxxxxxxxxxx
Other Applicationsxxxxxxxxxxxxxxxxxx
Source: Secondary Research, Expert Interviews, and CONSAINSIGHTS Analysis

ITALY ARTIFICIAL INTELLIGENCE MARKET SIZE, BY PRODUCT, 2023-2030 (USD BILLION)

By Product20232024202520262027202820292030CAGR (2023-2030)
Forecast
Softwarexxxxxxxxxxxxxxxxxx
Hardwarexxxxxxxxxxxxxxxxxx
Servicesxxxxxxxxxxxxxxxxxx
Source: Secondary Research, Expert Interviews, and CONSAINSIGHTS Analysis

ITALY ARTIFICIAL INTELLIGENCE MARKET SIZE, BY SOFTWARE, 2023-2030 (USD BILLION)

Software20232024202520262027202820292030CAGR (2023-2030)
Forecast
Mapping Softwarexxxxxxxxxxxxxxxxxx
Navigation Softwarexxxxxxxxxxxxxxxxxx
Geo-analytics Softwarexxxxxxxxxxxxxxxxxx
Source: Secondary Research, Expert Interviews, and CONSAINSIGHTS Analysis

ITALY ARTIFICIAL INTELLIGENCE MARKET SIZE, BY PRODUCT, 2023-2030 (USD BILLION)

By Product20232024202520262027202820292030CAGR (2023-2030)
Forecast
Softwarexxxxxxxxxxxxxxxxxx
Hardwarexxxxxxxxxxxxxxxxxx
Servicesxxxxxxxxxxxxxxxxxx
Source: Secondary Research, Expert Interviews, and CONSAINSIGHTS Analysis

ITALY ARTIFICIAL INTELLIGENCE MARKET SIZE, BY HARDWARE, 2023-2030 (USD BILLION)

Hardware20232024202520262027202820292030CAGR (2023-2030)
Forecast
Mapping Devicesxxxxxxxxxxxxxxxxxx
GPS Devicesxxxxxxxxxxxxxxxxxx
Drones for Mappingxxxxxxxxxxxxxxxxxx
Source: Secondary Research, Expert Interviews, and CONSAINSIGHTS Analysis

ITALY ARTIFICIAL INTELLIGENCE MARKET SIZE, BY PRODUCT, 2023-2030 (USD BILLION)

By Product20232024202520262027202820292030CAGR (2023-2030)
Forecast
Softwarexxxxxxxxxxxxxxxxxx
Hardwarexxxxxxxxxxxxxxxxxx
Servicesxxxxxxxxxxxxxxxxxx
Source: Secondary Research, Expert Interviews, and CONSAINSIGHTS Analysis

ITALY ARTIFICIAL INTELLIGENCE MARKET SIZE, BY SERVICES, 2023-2030 (USD BILLION)

Services20232024202520262027202820292030CAGR (2023-2030)
Forecast
Consulting Servicesxxxxxxxxxxxxxxxxxx
Mapping and Analysis Servicesxxxxxxxxxxxxxxxxxx
Maintenance and Support Servicesxxxxxxxxxxxxxxxxxx
Source: Secondary Research, Expert Interviews, and CONSAINSIGHTS Analysis

ITALY ARTIFICIAL INTELLIGENCE MARKET SIZE, BY APPLICATION, 2023-2030 (USD BILLION)

By Application20232024202520262027202820292030CAGR (2023-2030)
Forecast
Transportationxxxxxxxxxxxxxxxxxx
Urban Planningxxxxxxxxxxxxxxxxxx
Real Estatexxxxxxxxxxxxxxxxxx
Disaster Managementxxxxxxxxxxxxxxxxxx
Agriculturexxxxxxxxxxxxxxxxxx
Tourismxxxxxxxxxxxxxxxxxx
Other Applicationsxxxxxxxxxxxxxxxxxx
Source: Secondary Research, Expert Interviews, and CONSAINSIGHTS Analysis

SPAIN ARTIFICIAL INTELLIGENCE MARKET SIZE, BY PRODUCT, 2023-2030 (USD BILLION)

By Product20232024202520262027202820292030CAGR (2023-2030)
Forecast
Softwarexxxxxxxxxxxxxxxxxx
Hardwarexxxxxxxxxxxxxxxxxx
Servicesxxxxxxxxxxxxxxxxxx
Source: Secondary Research, Expert Interviews, and CONSAINSIGHTS Analysis

SPAIN ARTIFICIAL INTELLIGENCE MARKET SIZE, BY SOFTWARE, 2023-2030 (USD BILLION)

Software20232024202520262027202820292030CAGR (2023-2030)
Forecast
Mapping Softwarexxxxxxxxxxxxxxxxxx
Navigation Softwarexxxxxxxxxxxxxxxxxx
Geo-analytics Softwarexxxxxxxxxxxxxxxxxx
Source: Secondary Research, Expert Interviews, and CONSAINSIGHTS Analysis

SPAIN ARTIFICIAL INTELLIGENCE MARKET SIZE, BY PRODUCT, 2023-2030 (USD BILLION)

By Product20232024202520262027202820292030CAGR (2023-2030)
Forecast
Softwarexxxxxxxxxxxxxxxxxx
Hardwarexxxxxxxxxxxxxxxxxx
Servicesxxxxxxxxxxxxxxxxxx
Source: Secondary Research, Expert Interviews, and CONSAINSIGHTS Analysis

SPAIN ARTIFICIAL INTELLIGENCE MARKET SIZE, BY HARDWARE, 2023-2030 (USD BILLION)

Hardware20232024202520262027202820292030CAGR (2023-2030)
Forecast
Mapping Devicesxxxxxxxxxxxxxxxxxx
GPS Devicesxxxxxxxxxxxxxxxxxx
Drones for Mappingxxxxxxxxxxxxxxxxxx
Source: Secondary Research, Expert Interviews, and CONSAINSIGHTS Analysis

SPAIN ARTIFICIAL INTELLIGENCE MARKET SIZE, BY PRODUCT, 2023-2030 (USD BILLION)

By Product20232024202520262027202820292030CAGR (2023-2030)
Forecast
Softwarexxxxxxxxxxxxxxxxxx
Hardwarexxxxxxxxxxxxxxxxxx
Servicesxxxxxxxxxxxxxxxxxx
Source: Secondary Research, Expert Interviews, and CONSAINSIGHTS Analysis

SPAIN ARTIFICIAL INTELLIGENCE MARKET SIZE, BY SERVICES, 2023-2030 (USD BILLION)

Services20232024202520262027202820292030CAGR (2023-2030)
Forecast
Consulting Servicesxxxxxxxxxxxxxxxxxx
Mapping and Analysis Servicesxxxxxxxxxxxxxxxxxx
Maintenance and Support Servicesxxxxxxxxxxxxxxxxxx
Source: Secondary Research, Expert Interviews, and CONSAINSIGHTS Analysis

SPAIN ARTIFICIAL INTELLIGENCE MARKET SIZE, BY APPLICATION, 2023-2030 (USD BILLION)

By Application20232024202520262027202820292030CAGR (2023-2030)
Forecast
Transportationxxxxxxxxxxxxxxxxxx
Urban Planningxxxxxxxxxxxxxxxxxx
Real Estatexxxxxxxxxxxxxxxxxx
Disaster Managementxxxxxxxxxxxxxxxxxx
Agriculturexxxxxxxxxxxxxxxxxx
Tourismxxxxxxxxxxxxxxxxxx
Other Applicationsxxxxxxxxxxxxxxxxxx
Source: Secondary Research, Expert Interviews, and CONSAINSIGHTS Analysis

ASIA-PACIFIC ARTIFICIAL INTELLIGENCE MARKET SIZE, BY PRODUCT, 2023-2030 (USD BILLION)

By Product20232024202520262027202820292030CAGR (2023-2030)
Forecast
Softwarexxxxxxxxxxxxxxxxxx
Hardwarexxxxxxxxxxxxxxxxxx
Servicesxxxxxxxxxxxxxxxxxx
Source: Secondary Research, Expert Interviews, and CONSAINSIGHTS Analysis

ASIA-PACIFIC ARTIFICIAL INTELLIGENCE MARKET SIZE, BY SOFTWARE, 2023-2030 (USD BILLION)

Software20232024202520262027202820292030CAGR (2023-2030)
Forecast
Mapping Softwarexxxxxxxxxxxxxxxxxx
Navigation Softwarexxxxxxxxxxxxxxxxxx
Geo-analytics Softwarexxxxxxxxxxxxxxxxxx
Source: Secondary Research, Expert Interviews, and CONSAINSIGHTS Analysis

ASIA-PACIFIC ARTIFICIAL INTELLIGENCE MARKET SIZE, BY PRODUCT, 2023-2030 (USD BILLION)

By Product20232024202520262027202820292030CAGR (2023-2030)
Forecast
Softwarexxxxxxxxxxxxxxxxxx
Hardwarexxxxxxxxxxxxxxxxxx
Servicesxxxxxxxxxxxxxxxxxx
Source: Secondary Research, Expert Interviews, and CONSAINSIGHTS Analysis

ASIA-PACIFIC ARTIFICIAL INTELLIGENCE MARKET SIZE, BY HARDWARE, 2023-2030 (USD BILLION)

Hardware20232024202520262027202820292030CAGR (2023-2030)
Forecast
Mapping Devicesxxxxxxxxxxxxxxxxxx
GPS Devicesxxxxxxxxxxxxxxxxxx
Drones for Mappingxxxxxxxxxxxxxxxxxx
Source: Secondary Research, Expert Interviews, and CONSAINSIGHTS Analysis

ASIA-PACIFIC ARTIFICIAL INTELLIGENCE MARKET SIZE, BY PRODUCT, 2023-2030 (USD BILLION)

By Product20232024202520262027202820292030CAGR (2023-2030)
Forecast
Softwarexxxxxxxxxxxxxxxxxx
Hardwarexxxxxxxxxxxxxxxxxx
Servicesxxxxxxxxxxxxxxxxxx
Source: Secondary Research, Expert Interviews, and CONSAINSIGHTS Analysis

ASIA-PACIFIC ARTIFICIAL INTELLIGENCE MARKET SIZE, BY SERVICES, 2023-2030 (USD BILLION)

Services20232024202520262027202820292030CAGR (2023-2030)
Forecast
Consulting Servicesxxxxxxxxxxxxxxxxxx
Mapping and Analysis Servicesxxxxxxxxxxxxxxxxxx
Maintenance and Support Servicesxxxxxxxxxxxxxxxxxx
Source: Secondary Research, Expert Interviews, and CONSAINSIGHTS Analysis

ASIA-PACIFIC ARTIFICIAL INTELLIGENCE MARKET SIZE, BY APPLICATION, 2023-2030 (USD BILLION)

By Application20232024202520262027202820292030CAGR (2023-2030)
Forecast
Transportationxxxxxxxxxxxxxxxxxx
Urban Planningxxxxxxxxxxxxxxxxxx
Real Estatexxxxxxxxxxxxxxxxxx
Disaster Managementxxxxxxxxxxxxxxxxxx
Agriculturexxxxxxxxxxxxxxxxxx
Tourismxxxxxxxxxxxxxxxxxx
Other Applicationsxxxxxxxxxxxxxxxxxx
Source: Secondary Research, Expert Interviews, and CONSAINSIGHTS Analysis

CHINA ARTIFICIAL INTELLIGENCE MARKET SIZE, BY PRODUCT, 2023-2030 (USD BILLION)

By Product20232024202520262027202820292030CAGR (2023-2030)
Forecast
Softwarexxxxxxxxxxxxxxxxxx
Hardwarexxxxxxxxxxxxxxxxxx
Servicesxxxxxxxxxxxxxxxxxx
Source: Secondary Research, Expert Interviews, and CONSAINSIGHTS Analysis

CHINA ARTIFICIAL INTELLIGENCE MARKET SIZE, BY SOFTWARE, 2023-2030 (USD BILLION)

Software20232024202520262027202820292030CAGR (2023-2030)
Forecast
Mapping Softwarexxxxxxxxxxxxxxxxxx
Navigation Softwarexxxxxxxxxxxxxxxxxx
Geo-analytics Softwarexxxxxxxxxxxxxxxxxx
Source: Secondary Research, Expert Interviews, and CONSAINSIGHTS Analysis

CHINA ARTIFICIAL INTELLIGENCE MARKET SIZE, BY PRODUCT, 2023-2030 (USD BILLION)

By Product20232024202520262027202820292030CAGR (2023-2030)
Forecast
Softwarexxxxxxxxxxxxxxxxxx
Hardwarexxxxxxxxxxxxxxxxxx
Servicesxxxxxxxxxxxxxxxxxx
Source: Secondary Research, Expert Interviews, and CONSAINSIGHTS Analysis

CHINA ARTIFICIAL INTELLIGENCE MARKET SIZE, BY HARDWARE, 2023-2030 (USD BILLION)

Hardware20232024202520262027202820292030CAGR (2023-2030)
Forecast
Mapping Devicesxxxxxxxxxxxxxxxxxx
GPS Devicesxxxxxxxxxxxxxxxxxx
Drones for Mappingxxxxxxxxxxxxxxxxxx
Source: Secondary Research, Expert Interviews, and CONSAINSIGHTS Analysis

CHINA ARTIFICIAL INTELLIGENCE MARKET SIZE, BY PRODUCT, 2023-2030 (USD BILLION)

By Product20232024202520262027202820292030CAGR (2023-2030)
Forecast
Softwarexxxxxxxxxxxxxxxxxx
Hardwarexxxxxxxxxxxxxxxxxx
Servicesxxxxxxxxxxxxxxxxxx
Source: Secondary Research, Expert Interviews, and CONSAINSIGHTS Analysis

CHINA ARTIFICIAL INTELLIGENCE MARKET SIZE, BY SERVICES, 2023-2030 (USD BILLION)

Services20232024202520262027202820292030CAGR (2023-2030)
Forecast
Consulting Servicesxxxxxxxxxxxxxxxxxx
Mapping and Analysis Servicesxxxxxxxxxxxxxxxxxx
Maintenance and Support Servicesxxxxxxxxxxxxxxxxxx
Source: Secondary Research, Expert Interviews, and CONSAINSIGHTS Analysis

CHINA ARTIFICIAL INTELLIGENCE MARKET SIZE, BY APPLICATION, 2023-2030 (USD BILLION)

By Application20232024202520262027202820292030CAGR (2023-2030)
Forecast
Transportationxxxxxxxxxxxxxxxxxx
Urban Planningxxxxxxxxxxxxxxxxxx
Real Estatexxxxxxxxxxxxxxxxxx
Disaster Managementxxxxxxxxxxxxxxxxxx
Agriculturexxxxxxxxxxxxxxxxxx
Tourismxxxxxxxxxxxxxxxxxx
Other Applicationsxxxxxxxxxxxxxxxxxx
Source: Secondary Research, Expert Interviews, and CONSAINSIGHTS Analysis

JAPAN ARTIFICIAL INTELLIGENCE MARKET SIZE, BY PRODUCT, 2023-2030 (USD BILLION)

By Product20232024202520262027202820292030CAGR (2023-2030)
Forecast
Softwarexxxxxxxxxxxxxxxxxx
Hardwarexxxxxxxxxxxxxxxxxx
Servicesxxxxxxxxxxxxxxxxxx
Source: Secondary Research, Expert Interviews, and CONSAINSIGHTS Analysis

JAPAN ARTIFICIAL INTELLIGENCE MARKET SIZE, BY SOFTWARE, 2023-2030 (USD BILLION)

Software20232024202520262027202820292030CAGR (2023-2030)
Forecast
Mapping Softwarexxxxxxxxxxxxxxxxxx
Navigation Softwarexxxxxxxxxxxxxxxxxx
Geo-analytics Softwarexxxxxxxxxxxxxxxxxx
Source: Secondary Research, Expert Interviews, and CONSAINSIGHTS Analysis

JAPAN ARTIFICIAL INTELLIGENCE MARKET SIZE, BY PRODUCT, 2023-2030 (USD BILLION)

By Product20232024202520262027202820292030CAGR (2023-2030)
Forecast
Softwarexxxxxxxxxxxxxxxxxx
Hardwarexxxxxxxxxxxxxxxxxx
Servicesxxxxxxxxxxxxxxxxxx
Source: Secondary Research, Expert Interviews, and CONSAINSIGHTS Analysis

JAPAN ARTIFICIAL INTELLIGENCE MARKET SIZE, BY HARDWARE, 2023-2030 (USD BILLION)

Hardware20232024202520262027202820292030CAGR (2023-2030)
Forecast
Mapping Devicesxxxxxxxxxxxxxxxxxx
GPS Devicesxxxxxxxxxxxxxxxxxx
Drones for Mappingxxxxxxxxxxxxxxxxxx
Source: Secondary Research, Expert Interviews, and CONSAINSIGHTS Analysis

JAPAN ARTIFICIAL INTELLIGENCE MARKET SIZE, BY PRODUCT, 2023-2030 (USD BILLION)

By Product20232024202520262027202820292030CAGR (2023-2030)
Forecast
Softwarexxxxxxxxxxxxxxxxxx
Hardwarexxxxxxxxxxxxxxxxxx
Servicesxxxxxxxxxxxxxxxxxx
Source: Secondary Research, Expert Interviews, and CONSAINSIGHTS Analysis

JAPAN ARTIFICIAL INTELLIGENCE MARKET SIZE, BY SERVICES, 2023-2030 (USD BILLION)

Services20232024202520262027202820292030CAGR (2023-2030)
Forecast
Consulting Servicesxxxxxxxxxxxxxxxxxx
Mapping and Analysis Servicesxxxxxxxxxxxxxxxxxx
Maintenance and Support Servicesxxxxxxxxxxxxxxxxxx
Source: Secondary Research, Expert Interviews, and CONSAINSIGHTS Analysis

JAPAN ARTIFICIAL INTELLIGENCE MARKET SIZE, BY APPLICATION, 2023-2030 (USD BILLION)

By Application20232024202520262027202820292030CAGR (2023-2030)
Forecast
Transportationxxxxxxxxxxxxxxxxxx
Urban Planningxxxxxxxxxxxxxxxxxx
Real Estatexxxxxxxxxxxxxxxxxx
Disaster Managementxxxxxxxxxxxxxxxxxx
Agriculturexxxxxxxxxxxxxxxxxx
Tourismxxxxxxxxxxxxxxxxxx
Other Applicationsxxxxxxxxxxxxxxxxxx
Source: Secondary Research, Expert Interviews, and CONSAINSIGHTS Analysis

INDIA ARTIFICIAL INTELLIGENCE MARKET SIZE, BY PRODUCT, 2023-2030 (USD BILLION)

By Product20232024202520262027202820292030CAGR (2023-2030)
Forecast
Softwarexxxxxxxxxxxxxxxxxx
Hardwarexxxxxxxxxxxxxxxxxx
Servicesxxxxxxxxxxxxxxxxxx
Source: Secondary Research, Expert Interviews, and CONSAINSIGHTS Analysis

INDIA ARTIFICIAL INTELLIGENCE MARKET SIZE, BY SOFTWARE, 2023-2030 (USD BILLION)

Software20232024202520262027202820292030CAGR (2023-2030)
Forecast
Mapping Softwarexxxxxxxxxxxxxxxxxx
Navigation Softwarexxxxxxxxxxxxxxxxxx
Geo-analytics Softwarexxxxxxxxxxxxxxxxxx
Source: Secondary Research, Expert Interviews, and CONSAINSIGHTS Analysis

INDIA ARTIFICIAL INTELLIGENCE MARKET SIZE, BY PRODUCT, 2023-2030 (USD BILLION)

By Product20232024202520262027202820292030CAGR (2023-2030)
Forecast
Softwarexxxxxxxxxxxxxxxxxx
Hardwarexxxxxxxxxxxxxxxxxx
Servicesxxxxxxxxxxxxxxxxxx
Source: Secondary Research, Expert Interviews, and CONSAINSIGHTS Analysis

INDIA ARTIFICIAL INTELLIGENCE MARKET SIZE, BY HARDWARE, 2023-2030 (USD BILLION)

Hardware20232024202520262027202820292030CAGR (2023-2030)
Forecast
Mapping Devicesxxxxxxxxxxxxxxxxxx
GPS Devicesxxxxxxxxxxxxxxxxxx
Drones for Mappingxxxxxxxxxxxxxxxxxx
Source: Secondary Research, Expert Interviews, and CONSAINSIGHTS Analysis

INDIA ARTIFICIAL INTELLIGENCE MARKET SIZE, BY PRODUCT, 2023-2030 (USD BILLION)

By Product20232024202520262027202820292030CAGR (2023-2030)
Forecast
Softwarexxxxxxxxxxxxxxxxxx
Hardwarexxxxxxxxxxxxxxxxxx
Servicesxxxxxxxxxxxxxxxxxx
Source: Secondary Research, Expert Interviews, and CONSAINSIGHTS Analysis

INDIA ARTIFICIAL INTELLIGENCE MARKET SIZE, BY SERVICES, 2023-2030 (USD BILLION)

Services20232024202520262027202820292030CAGR (2023-2030)
Forecast
Consulting Servicesxxxxxxxxxxxxxxxxxx
Mapping and Analysis Servicesxxxxxxxxxxxxxxxxxx
Maintenance and Support Servicesxxxxxxxxxxxxxxxxxx
Source: Secondary Research, Expert Interviews, and CONSAINSIGHTS Analysis

INDIA ARTIFICIAL INTELLIGENCE MARKET SIZE, BY APPLICATION, 2023-2030 (USD BILLION)

By Application20232024202520262027202820292030CAGR (2023-2030)
Forecast
Transportationxxxxxxxxxxxxxxxxxx
Urban Planningxxxxxxxxxxxxxxxxxx
Real Estatexxxxxxxxxxxxxxxxxx
Disaster Managementxxxxxxxxxxxxxxxxxx
Agriculturexxxxxxxxxxxxxxxxxx
Tourismxxxxxxxxxxxxxxxxxx
Other Applicationsxxxxxxxxxxxxxxxxxx
Source: Secondary Research, Expert Interviews, and CONSAINSIGHTS Analysis

SOUTH KOREA ARTIFICIAL INTELLIGENCE MARKET SIZE, BY PRODUCT, 2023-2030 (USD BILLION)

By Product20232024202520262027202820292030CAGR (2023-2030)
Forecast
Softwarexxxxxxxxxxxxxxxxxx
Hardwarexxxxxxxxxxxxxxxxxx
Servicesxxxxxxxxxxxxxxxxxx
Source: Secondary Research, Expert Interviews, and CONSAINSIGHTS Analysis

SOUTH KOREA ARTIFICIAL INTELLIGENCE MARKET SIZE, BY SOFTWARE, 2023-2030 (USD BILLION)

Software20232024202520262027202820292030CAGR (2023-2030)
Forecast
Mapping Softwarexxxxxxxxxxxxxxxxxx
Navigation Softwarexxxxxxxxxxxxxxxxxx
Geo-analytics Softwarexxxxxxxxxxxxxxxxxx
Source: Secondary Research, Expert Interviews, and CONSAINSIGHTS Analysis

SOUTH KOREA ARTIFICIAL INTELLIGENCE MARKET SIZE, BY PRODUCT, 2023-2030 (USD BILLION)

By Product20232024202520262027202820292030CAGR (2023-2030)
Forecast
Softwarexxxxxxxxxxxxxxxxxx
Hardwarexxxxxxxxxxxxxxxxxx
Servicesxxxxxxxxxxxxxxxxxx
Source: Secondary Research, Expert Interviews, and CONSAINSIGHTS Analysis

SOUTH KOREA ARTIFICIAL INTELLIGENCE MARKET SIZE, BY HARDWARE, 2023-2030 (USD BILLION)

Hardware20232024202520262027202820292030CAGR (2023-2030)
Forecast
Mapping Devicesxxxxxxxxxxxxxxxxxx
GPS Devicesxxxxxxxxxxxxxxxxxx
Drones for Mappingxxxxxxxxxxxxxxxxxx
Source: Secondary Research, Expert Interviews, and CONSAINSIGHTS Analysis

SOUTH KOREA ARTIFICIAL INTELLIGENCE MARKET SIZE, BY PRODUCT, 2023-2030 (USD BILLION)

By Product20232024202520262027202820292030CAGR (2023-2030)
Forecast
Softwarexxxxxxxxxxxxxxxxxx
Hardwarexxxxxxxxxxxxxxxxxx
Servicesxxxxxxxxxxxxxxxxxx
Source: Secondary Research, Expert Interviews, and CONSAINSIGHTS Analysis

SOUTH KOREA ARTIFICIAL INTELLIGENCE MARKET SIZE, BY SERVICES, 2023-2030 (USD BILLION)

Services20232024202520262027202820292030CAGR (2023-2030)
Forecast
Consulting Servicesxxxxxxxxxxxxxxxxxx
Mapping and Analysis Servicesxxxxxxxxxxxxxxxxxx
Maintenance and Support Servicesxxxxxxxxxxxxxxxxxx
Source: Secondary Research, Expert Interviews, and CONSAINSIGHTS Analysis

SOUTH KOREA ARTIFICIAL INTELLIGENCE MARKET SIZE, BY APPLICATION, 2023-2030 (USD BILLION)

By Application20232024202520262027202820292030CAGR (2023-2030)
Forecast
Transportationxxxxxxxxxxxxxxxxxx
Urban Planningxxxxxxxxxxxxxxxxxx
Real Estatexxxxxxxxxxxxxxxxxx
Disaster Managementxxxxxxxxxxxxxxxxxx
Agriculturexxxxxxxxxxxxxxxxxx
Tourismxxxxxxxxxxxxxxxxxx
Other Applicationsxxxxxxxxxxxxxxxxxx
Source: Secondary Research, Expert Interviews, and CONSAINSIGHTS Analysis

AUSTRALIA ARTIFICIAL INTELLIGENCE MARKET SIZE, BY PRODUCT, 2023-2030 (USD BILLION)

By Product20232024202520262027202820292030CAGR (2023-2030)
Forecast
Softwarexxxxxxxxxxxxxxxxxx
Hardwarexxxxxxxxxxxxxxxxxx
Servicesxxxxxxxxxxxxxxxxxx
Source: Secondary Research, Expert Interviews, and CONSAINSIGHTS Analysis

AUSTRALIA ARTIFICIAL INTELLIGENCE MARKET SIZE, BY SOFTWARE, 2023-2030 (USD BILLION)

Software20232024202520262027202820292030CAGR (2023-2030)
Forecast
Mapping Softwarexxxxxxxxxxxxxxxxxx
Navigation Softwarexxxxxxxxxxxxxxxxxx
Geo-analytics Softwarexxxxxxxxxxxxxxxxxx
Source: Secondary Research, Expert Interviews, and CONSAINSIGHTS Analysis

AUSTRALIA ARTIFICIAL INTELLIGENCE MARKET SIZE, BY PRODUCT, 2023-2030 (USD BILLION)

By Product20232024202520262027202820292030CAGR (2023-2030)
Forecast
Softwarexxxxxxxxxxxxxxxxxx
Hardwarexxxxxxxxxxxxxxxxxx
Servicesxxxxxxxxxxxxxxxxxx
Source: Secondary Research, Expert Interviews, and CONSAINSIGHTS Analysis

AUSTRALIA ARTIFICIAL INTELLIGENCE MARKET SIZE, BY HARDWARE, 2023-2030 (USD BILLION)

Hardware20232024202520262027202820292030CAGR (2023-2030)
Forecast
Mapping Devicesxxxxxxxxxxxxxxxxxx
GPS Devicesxxxxxxxxxxxxxxxxxx
Drones for Mappingxxxxxxxxxxxxxxxxxx
Source: Secondary Research, Expert Interviews, and CONSAINSIGHTS Analysis

AUSTRALIA ARTIFICIAL INTELLIGENCE MARKET SIZE, BY PRODUCT, 2023-2030 (USD BILLION)

By Product20232024202520262027202820292030CAGR (2023-2030)
Forecast
Softwarexxxxxxxxxxxxxxxxxx
Hardwarexxxxxxxxxxxxxxxxxx
Servicesxxxxxxxxxxxxxxxxxx
Source: Secondary Research, Expert Interviews, and CONSAINSIGHTS Analysis

AUSTRALIA ARTIFICIAL INTELLIGENCE MARKET SIZE, BY SERVICES, 2023-2030 (USD BILLION)

Services20232024202520262027202820292030CAGR (2023-2030)
Forecast
Consulting Servicesxxxxxxxxxxxxxxxxxx
Mapping and Analysis Servicesxxxxxxxxxxxxxxxxxx
Maintenance and Support Servicesxxxxxxxxxxxxxxxxxx
Source: Secondary Research, Expert Interviews, and CONSAINSIGHTS Analysis

AUSTRALIA ARTIFICIAL INTELLIGENCE MARKET SIZE, BY APPLICATION, 2023-2030 (USD BILLION)

By Application20232024202520262027202820292030CAGR (2023-2030)
Forecast
Transportationxxxxxxxxxxxxxxxxxx
Urban Planningxxxxxxxxxxxxxxxxxx
Real Estatexxxxxxxxxxxxxxxxxx
Disaster Managementxxxxxxxxxxxxxxxxxx
Agriculturexxxxxxxxxxxxxxxxxx
Tourismxxxxxxxxxxxxxxxxxx
Other Applicationsxxxxxxxxxxxxxxxxxx
Source: Secondary Research, Expert Interviews, and CONSAINSIGHTS Analysis

MIDDLE-EAST & AFRICA ARTIFICIAL INTELLIGENCE MARKET SIZE, BY PRODUCT, 2023-2030 (USD BILLION)

By Product20232024202520262027202820292030CAGR (2023-2030)
Forecast
Softwarexxxxxxxxxxxxxxxxxx
Hardwarexxxxxxxxxxxxxxxxxx
Servicesxxxxxxxxxxxxxxxxxx
Source: Secondary Research, Expert Interviews, and CONSAINSIGHTS Analysis

MIDDLE-EAST & AFRICA ARTIFICIAL INTELLIGENCE MARKET SIZE, BY SOFTWARE, 2023-2030 (USD BILLION)

Software20232024202520262027202820292030CAGR (2023-2030)
Forecast
Mapping Softwarexxxxxxxxxxxxxxxxxx
Navigation Softwarexxxxxxxxxxxxxxxxxx
Geo-analytics Softwarexxxxxxxxxxxxxxxxxx
Source: Secondary Research, Expert Interviews, and CONSAINSIGHTS Analysis

MIDDLE-EAST & AFRICA ARTIFICIAL INTELLIGENCE MARKET SIZE, BY PRODUCT, 2023-2030 (USD BILLION)

By Product20232024202520262027202820292030CAGR (2023-2030)
Forecast
Softwarexxxxxxxxxxxxxxxxxx
Hardwarexxxxxxxxxxxxxxxxxx
Servicesxxxxxxxxxxxxxxxxxx
Source: Secondary Research, Expert Interviews, and CONSAINSIGHTS Analysis

MIDDLE-EAST & AFRICA ARTIFICIAL INTELLIGENCE MARKET SIZE, BY HARDWARE, 2023-2030 (USD BILLION)

Hardware20232024202520262027202820292030CAGR (2023-2030)
Forecast
Mapping Devicesxxxxxxxxxxxxxxxxxx
GPS Devicesxxxxxxxxxxxxxxxxxx
Drones for Mappingxxxxxxxxxxxxxxxxxx
Source: Secondary Research, Expert Interviews, and CONSAINSIGHTS Analysis

MIDDLE-EAST & AFRICA ARTIFICIAL INTELLIGENCE MARKET SIZE, BY PRODUCT, 2023-2030 (USD BILLION)

By Product20232024202520262027202820292030CAGR (2023-2030)
Forecast
Softwarexxxxxxxxxxxxxxxxxx
Hardwarexxxxxxxxxxxxxxxxxx
Servicesxxxxxxxxxxxxxxxxxx
Source: Secondary Research, Expert Interviews, and CONSAINSIGHTS Analysis

MIDDLE-EAST & AFRICA ARTIFICIAL INTELLIGENCE MARKET SIZE, BY SERVICES, 2023-2030 (USD BILLION)

Services20232024202520262027202820292030CAGR (2023-2030)
Forecast
Consulting Servicesxxxxxxxxxxxxxxxxxx
Mapping and Analysis Servicesxxxxxxxxxxxxxxxxxx
Maintenance and Support Servicesxxxxxxxxxxxxxxxxxx
Source: Secondary Research, Expert Interviews, and CONSAINSIGHTS Analysis

MIDDLE-EAST & AFRICA ARTIFICIAL INTELLIGENCE MARKET SIZE, BY APPLICATION, 2023-2030 (USD BILLION)

By Application20232024202520262027202820292030CAGR (2023-2030)
Forecast
Transportationxxxxxxxxxxxxxxxxxx
Urban Planningxxxxxxxxxxxxxxxxxx
Real Estatexxxxxxxxxxxxxxxxxx
Disaster Managementxxxxxxxxxxxxxxxxxx
Agriculturexxxxxxxxxxxxxxxxxx
Tourismxxxxxxxxxxxxxxxxxx
Other Applicationsxxxxxxxxxxxxxxxxxx
Source: Secondary Research, Expert Interviews, and CONSAINSIGHTS Analysis

UAE ARTIFICIAL INTELLIGENCE MARKET SIZE, BY PRODUCT, 2023-2030 (USD BILLION)

By Product20232024202520262027202820292030CAGR (2023-2030)
Forecast
Softwarexxxxxxxxxxxxxxxxxx
Hardwarexxxxxxxxxxxxxxxxxx
Servicesxxxxxxxxxxxxxxxxxx
Source: Secondary Research, Expert Interviews, and CONSAINSIGHTS Analysis

UAE ARTIFICIAL INTELLIGENCE MARKET SIZE, BY SOFTWARE, 2023-2030 (USD BILLION)

Software20232024202520262027202820292030CAGR (2023-2030)
Forecast
Mapping Softwarexxxxxxxxxxxxxxxxxx
Navigation Softwarexxxxxxxxxxxxxxxxxx
Geo-analytics Softwarexxxxxxxxxxxxxxxxxx
Source: Secondary Research, Expert Interviews, and CONSAINSIGHTS Analysis

UAE ARTIFICIAL INTELLIGENCE MARKET SIZE, BY PRODUCT, 2023-2030 (USD BILLION)

By Product20232024202520262027202820292030CAGR (2023-2030)
Forecast
Softwarexxxxxxxxxxxxxxxxxx
Hardwarexxxxxxxxxxxxxxxxxx
Servicesxxxxxxxxxxxxxxxxxx
Source: Secondary Research, Expert Interviews, and CONSAINSIGHTS Analysis

UAE ARTIFICIAL INTELLIGENCE MARKET SIZE, BY HARDWARE, 2023-2030 (USD BILLION)

Hardware20232024202520262027202820292030CAGR (2023-2030)
Forecast
Mapping Devicesxxxxxxxxxxxxxxxxxx
GPS Devicesxxxxxxxxxxxxxxxxxx
Drones for Mappingxxxxxxxxxxxxxxxxxx
Source: Secondary Research, Expert Interviews, and CONSAINSIGHTS Analysis

UAE ARTIFICIAL INTELLIGENCE MARKET SIZE, BY PRODUCT, 2023-2030 (USD BILLION)

By Product20232024202520262027202820292030CAGR (2023-2030)
Forecast
Softwarexxxxxxxxxxxxxxxxxx
Hardwarexxxxxxxxxxxxxxxxxx
Servicesxxxxxxxxxxxxxxxxxx
Source: Secondary Research, Expert Interviews, and CONSAINSIGHTS Analysis

UAE ARTIFICIAL INTELLIGENCE MARKET SIZE, BY SERVICES, 2023-2030 (USD BILLION)

Services20232024202520262027202820292030CAGR (2023-2030)
Forecast
Consulting Servicesxxxxxxxxxxxxxxxxxx
Mapping and Analysis Servicesxxxxxxxxxxxxxxxxxx
Maintenance and Support Servicesxxxxxxxxxxxxxxxxxx
Source: Secondary Research, Expert Interviews, and CONSAINSIGHTS Analysis

UAE ARTIFICIAL INTELLIGENCE MARKET SIZE, BY APPLICATION, 2023-2030 (USD BILLION)

By Application20232024202520262027202820292030CAGR (2023-2030)
Forecast
Transportationxxxxxxxxxxxxxxxxxx
Urban Planningxxxxxxxxxxxxxxxxxx
Real Estatexxxxxxxxxxxxxxxxxx
Disaster Managementxxxxxxxxxxxxxxxxxx
Agriculturexxxxxxxxxxxxxxxxxx
Tourismxxxxxxxxxxxxxxxxxx
Other Applicationsxxxxxxxxxxxxxxxxxx
Source: Secondary Research, Expert Interviews, and CONSAINSIGHTS Analysis

SOUTH AFRICA ARTIFICIAL INTELLIGENCE MARKET SIZE, BY PRODUCT, 2023-2030 (USD BILLION)

By Product20232024202520262027202820292030CAGR (2023-2030)
Forecast
Softwarexxxxxxxxxxxxxxxxxx
Hardwarexxxxxxxxxxxxxxxxxx
Servicesxxxxxxxxxxxxxxxxxx
Source: Secondary Research, Expert Interviews, and CONSAINSIGHTS Analysis

SOUTH AFRICA ARTIFICIAL INTELLIGENCE MARKET SIZE, BY SOFTWARE, 2023-2030 (USD BILLION)

Software20232024202520262027202820292030CAGR (2023-2030)
Forecast
Mapping Softwarexxxxxxxxxxxxxxxxxx
Navigation Softwarexxxxxxxxxxxxxxxxxx
Geo-analytics Softwarexxxxxxxxxxxxxxxxxx
Source: Secondary Research, Expert Interviews, and CONSAINSIGHTS Analysis

SOUTH AFRICA ARTIFICIAL INTELLIGENCE MARKET SIZE, BY PRODUCT, 2023-2030 (USD BILLION)

By Product20232024202520262027202820292030CAGR (2023-2030)
Forecast
Softwarexxxxxxxxxxxxxxxxxx
Hardwarexxxxxxxxxxxxxxxxxx
Servicesxxxxxxxxxxxxxxxxxx
Source: Secondary Research, Expert Interviews, and CONSAINSIGHTS Analysis

SOUTH AFRICA ARTIFICIAL INTELLIGENCE MARKET SIZE, BY HARDWARE, 2023-2030 (USD BILLION)

Hardware20232024202520262027202820292030CAGR (2023-2030)
Forecast
Mapping Devicesxxxxxxxxxxxxxxxxxx
GPS Devicesxxxxxxxxxxxxxxxxxx
Drones for Mappingxxxxxxxxxxxxxxxxxx
Source: Secondary Research, Expert Interviews, and CONSAINSIGHTS Analysis

SOUTH AFRICA ARTIFICIAL INTELLIGENCE MARKET SIZE, BY PRODUCT, 2023-2030 (USD BILLION)

By Product20232024202520262027202820292030CAGR (2023-2030)
Forecast
Softwarexxxxxxxxxxxxxxxxxx
Hardwarexxxxxxxxxxxxxxxxxx
Servicesxxxxxxxxxxxxxxxxxx
Source: Secondary Research, Expert Interviews, and CONSAINSIGHTS Analysis

SOUTH AFRICA ARTIFICIAL INTELLIGENCE MARKET SIZE, BY SERVICES, 2023-2030 (USD BILLION)

Services20232024202520262027202820292030CAGR (2023-2030)
Forecast
Consulting Servicesxxxxxxxxxxxxxxxxxx
Mapping and Analysis Servicesxxxxxxxxxxxxxxxxxx
Maintenance and Support Servicesxxxxxxxxxxxxxxxxxx
Source: Secondary Research, Expert Interviews, and CONSAINSIGHTS Analysis

SOUTH AFRICA ARTIFICIAL INTELLIGENCE MARKET SIZE, BY APPLICATION, 2023-2030 (USD BILLION)

By Application20232024202520262027202820292030CAGR (2023-2030)
Forecast
Transportationxxxxxxxxxxxxxxxxxx
Urban Planningxxxxxxxxxxxxxxxxxx
Real Estatexxxxxxxxxxxxxxxxxx
Disaster Managementxxxxxxxxxxxxxxxxxx
Agriculturexxxxxxxxxxxxxxxxxx
Tourismxxxxxxxxxxxxxxxxxx
Other Applicationsxxxxxxxxxxxxxxxxxx
Source: Secondary Research, Expert Interviews, and CONSAINSIGHTS Analysis

SAUDI ARABIA ARTIFICIAL INTELLIGENCE MARKET SIZE, BY PRODUCT, 2023-2030 (USD BILLION)

By Product20232024202520262027202820292030CAGR (2023-2030)
Forecast
Softwarexxxxxxxxxxxxxxxxxx
Hardwarexxxxxxxxxxxxxxxxxx
Servicesxxxxxxxxxxxxxxxxxx
Source: Secondary Research, Expert Interviews, and CONSAINSIGHTS Analysis

SAUDI ARABIA ARTIFICIAL INTELLIGENCE MARKET SIZE, BY SOFTWARE, 2023-2030 (USD BILLION)

Software20232024202520262027202820292030CAGR (2023-2030)
Forecast
Mapping Softwarexxxxxxxxxxxxxxxxxx
Navigation Softwarexxxxxxxxxxxxxxxxxx
Geo-analytics Softwarexxxxxxxxxxxxxxxxxx
Source: Secondary Research, Expert Interviews, and CONSAINSIGHTS Analysis

SAUDI ARABIA ARTIFICIAL INTELLIGENCE MARKET SIZE, BY PRODUCT, 2023-2030 (USD BILLION)

By Product20232024202520262027202820292030CAGR (2023-2030)
Forecast
Softwarexxxxxxxxxxxxxxxxxx
Hardwarexxxxxxxxxxxxxxxxxx
Servicesxxxxxxxxxxxxxxxxxx
Source: Secondary Research, Expert Interviews, and CONSAINSIGHTS Analysis

SAUDI ARABIA ARTIFICIAL INTELLIGENCE MARKET SIZE, BY HARDWARE, 2023-2030 (USD BILLION)

Hardware20232024202520262027202820292030CAGR (2023-2030)
Forecast
Mapping Devicesxxxxxxxxxxxxxxxxxx
GPS Devicesxxxxxxxxxxxxxxxxxx
Drones for Mappingxxxxxxxxxxxxxxxxxx
Source: Secondary Research, Expert Interviews, and CONSAINSIGHTS Analysis

SAUDI ARABIA ARTIFICIAL INTELLIGENCE MARKET SIZE, BY PRODUCT, 2023-2030 (USD BILLION)

By Product20232024202520262027202820292030CAGR (2023-2030)
Forecast
Softwarexxxxxxxxxxxxxxxxxx
Hardwarexxxxxxxxxxxxxxxxxx
Servicesxxxxxxxxxxxxxxxxxx
Source: Secondary Research, Expert Interviews, and CONSAINSIGHTS Analysis

SAUDI ARABIA ARTIFICIAL INTELLIGENCE MARKET SIZE, BY SERVICES, 2023-2030 (USD BILLION)

Services20232024202520262027202820292030CAGR (2023-2030)
Forecast
Consulting Servicesxxxxxxxxxxxxxxxxxx
Mapping and Analysis Servicesxxxxxxxxxxxxxxxxxx
Maintenance and Support Servicesxxxxxxxxxxxxxxxxxx
Source: Secondary Research, Expert Interviews, and CONSAINSIGHTS Analysis

SAUDI ARABIA ARTIFICIAL INTELLIGENCE MARKET SIZE, BY APPLICATION, 2023-2030 (USD BILLION)

By Application20232024202520262027202820292030CAGR (2023-2030)
Forecast
Transportationxxxxxxxxxxxxxxxxxx
Urban Planningxxxxxxxxxxxxxxxxxx
Real Estatexxxxxxxxxxxxxxxxxx
Disaster Managementxxxxxxxxxxxxxxxxxx
Agriculturexxxxxxxxxxxxxxxxxx
Tourismxxxxxxxxxxxxxxxxxx
Other Applicationsxxxxxxxxxxxxxxxxxx
Source: Secondary Research, Expert Interviews, and CONSAINSIGHTS Analysis

LATIN AMERICA ARTIFICIAL INTELLIGENCE MARKET SIZE, BY PRODUCT, 2023-2030 (USD BILLION)

By Product20232024202520262027202820292030CAGR (2023-2030)
Forecast
Softwarexxxxxxxxxxxxxxxxxx
Hardwarexxxxxxxxxxxxxxxxxx
Servicesxxxxxxxxxxxxxxxxxx
Source: Secondary Research, Expert Interviews, and CONSAINSIGHTS Analysis

LATIN AMERICA ARTIFICIAL INTELLIGENCE MARKET SIZE, BY SOFTWARE, 2023-2030 (USD BILLION)

Software20232024202520262027202820292030CAGR (2023-2030)
Forecast
Mapping Softwarexxxxxxxxxxxxxxxxxx
Navigation Softwarexxxxxxxxxxxxxxxxxx
Geo-analytics Softwarexxxxxxxxxxxxxxxxxx
Source: Secondary Research, Expert Interviews, and CONSAINSIGHTS Analysis

LATIN AMERICA ARTIFICIAL INTELLIGENCE MARKET SIZE, BY PRODUCT, 2023-2030 (USD BILLION)

By Product20232024202520262027202820292030CAGR (2023-2030)
Forecast
Softwarexxxxxxxxxxxxxxxxxx
Hardwarexxxxxxxxxxxxxxxxxx
Servicesxxxxxxxxxxxxxxxxxx
Source: Secondary Research, Expert Interviews, and CONSAINSIGHTS Analysis

LATIN AMERICA ARTIFICIAL INTELLIGENCE MARKET SIZE, BY HARDWARE, 2023-2030 (USD BILLION)

Hardware20232024202520262027202820292030CAGR (2023-2030)
Forecast
Mapping Devicesxxxxxxxxxxxxxxxxxx
GPS Devicesxxxxxxxxxxxxxxxxxx
Drones for Mappingxxxxxxxxxxxxxxxxxx
Source: Secondary Research, Expert Interviews, and CONSAINSIGHTS Analysis

LATIN AMERICA ARTIFICIAL INTELLIGENCE MARKET SIZE, BY PRODUCT, 2023-2030 (USD BILLION)

By Product20232024202520262027202820292030CAGR (2023-2030)
Forecast
Softwarexxxxxxxxxxxxxxxxxx
Hardwarexxxxxxxxxxxxxxxxxx
Servicesxxxxxxxxxxxxxxxxxx
Source: Secondary Research, Expert Interviews, and CONSAINSIGHTS Analysis

LATIN AMERICA ARTIFICIAL INTELLIGENCE MARKET SIZE, BY SERVICES, 2023-2030 (USD BILLION)

Services20232024202520262027202820292030CAGR (2023-2030)
Forecast
Consulting Servicesxxxxxxxxxxxxxxxxxx
Mapping and Analysis Servicesxxxxxxxxxxxxxxxxxx
Maintenance and Support Servicesxxxxxxxxxxxxxxxxxx
Source: Secondary Research, Expert Interviews, and CONSAINSIGHTS Analysis

LATIN AMERICA ARTIFICIAL INTELLIGENCE MARKET SIZE, BY APPLICATION, 2023-2030 (USD BILLION)

By Application20232024202520262027202820292030CAGR (2023-2030)
Forecast
Transportationxxxxxxxxxxxxxxxxxx
Urban Planningxxxxxxxxxxxxxxxxxx
Real Estatexxxxxxxxxxxxxxxxxx
Disaster Managementxxxxxxxxxxxxxxxxxx
Agriculturexxxxxxxxxxxxxxxxxx
Tourismxxxxxxxxxxxxxxxxxx
Other Applicationsxxxxxxxxxxxxxxxxxx
Source: Secondary Research, Expert Interviews, and CONSAINSIGHTS Analysis

BRAZIL ARTIFICIAL INTELLIGENCE MARKET SIZE, BY PRODUCT, 2023-2030 (USD BILLION)

By Product20232024202520262027202820292030CAGR (2023-2030)
Forecast
Softwarexxxxxxxxxxxxxxxxxx
Hardwarexxxxxxxxxxxxxxxxxx
Servicesxxxxxxxxxxxxxxxxxx
Source: Secondary Research, Expert Interviews, and CONSAINSIGHTS Analysis

BRAZIL ARTIFICIAL INTELLIGENCE MARKET SIZE, BY SOFTWARE, 2023-2030 (USD BILLION)

Software20232024202520262027202820292030CAGR (2023-2030)
Forecast
Mapping Softwarexxxxxxxxxxxxxxxxxx
Navigation Softwarexxxxxxxxxxxxxxxxxx
Geo-analytics Softwarexxxxxxxxxxxxxxxxxx
Source: Secondary Research, Expert Interviews, and CONSAINSIGHTS Analysis

BRAZIL ARTIFICIAL INTELLIGENCE MARKET SIZE, BY PRODUCT, 2023-2030 (USD BILLION)

By Product20232024202520262027202820292030CAGR (2023-2030)
Forecast
Softwarexxxxxxxxxxxxxxxxxx
Hardwarexxxxxxxxxxxxxxxxxx
Servicesxxxxxxxxxxxxxxxxxx
Source: Secondary Research, Expert Interviews, and CONSAINSIGHTS Analysis

BRAZIL ARTIFICIAL INTELLIGENCE MARKET SIZE, BY HARDWARE, 2023-2030 (USD BILLION)

Hardware20232024202520262027202820292030CAGR (2023-2030)
Forecast
Mapping Devicesxxxxxxxxxxxxxxxxxx
GPS Devicesxxxxxxxxxxxxxxxxxx
Drones for Mappingxxxxxxxxxxxxxxxxxx
Source: Secondary Research, Expert Interviews, and CONSAINSIGHTS Analysis

BRAZIL ARTIFICIAL INTELLIGENCE MARKET SIZE, BY PRODUCT, 2023-2030 (USD BILLION)

By Product20232024202520262027202820292030CAGR (2023-2030)
Forecast
Softwarexxxxxxxxxxxxxxxxxx
Hardwarexxxxxxxxxxxxxxxxxx
Servicesxxxxxxxxxxxxxxxxxx
Source: Secondary Research, Expert Interviews, and CONSAINSIGHTS Analysis

BRAZIL ARTIFICIAL INTELLIGENCE MARKET SIZE, BY SERVICES, 2023-2030 (USD BILLION)

Services20232024202520262027202820292030CAGR (2023-2030)
Forecast
Consulting Servicesxxxxxxxxxxxxxxxxxx
Mapping and Analysis Servicesxxxxxxxxxxxxxxxxxx
Maintenance and Support Servicesxxxxxxxxxxxxxxxxxx
Source: Secondary Research, Expert Interviews, and CONSAINSIGHTS Analysis

BRAZIL ARTIFICIAL INTELLIGENCE MARKET SIZE, BY APPLICATION, 2023-2030 (USD BILLION)

By Application20232024202520262027202820292030CAGR (2023-2030)
Forecast
Transportationxxxxxxxxxxxxxxxxxx
Urban Planningxxxxxxxxxxxxxxxxxx
Real Estatexxxxxxxxxxxxxxxxxx
Disaster Managementxxxxxxxxxxxxxxxxxx
Agriculturexxxxxxxxxxxxxxxxxx
Tourismxxxxxxxxxxxxxxxxxx
Other Applicationsxxxxxxxxxxxxxxxxxx
Source: Secondary Research, Expert Interviews, and CONSAINSIGHTS Analysis

ARGENTINA ARTIFICIAL INTELLIGENCE MARKET SIZE, BY PRODUCT, 2023-2030 (USD BILLION)

By Product20232024202520262027202820292030CAGR (2023-2030)
Forecast
Softwarexxxxxxxxxxxxxxxxxx
Hardwarexxxxxxxxxxxxxxxxxx
Servicesxxxxxxxxxxxxxxxxxx
Source: Secondary Research, Expert Interviews, and CONSAINSIGHTS Analysis

ARGENTINA ARTIFICIAL INTELLIGENCE MARKET SIZE, BY SOFTWARE, 2023-2030 (USD BILLION)

Software20232024202520262027202820292030CAGR (2023-2030)
Forecast
Mapping Softwarexxxxxxxxxxxxxxxxxx
Navigation Softwarexxxxxxxxxxxxxxxxxx
Geo-analytics Softwarexxxxxxxxxxxxxxxxxx
Source: Secondary Research, Expert Interviews, and CONSAINSIGHTS Analysis

ARGENTINA ARTIFICIAL INTELLIGENCE MARKET SIZE, BY PRODUCT, 2023-2030 (USD BILLION)

By Product20232024202520262027202820292030CAGR (2023-2030)
Forecast
Softwarexxxxxxxxxxxxxxxxxx
Hardwarexxxxxxxxxxxxxxxxxx
Servicesxxxxxxxxxxxxxxxxxx
Source: Secondary Research, Expert Interviews, and CONSAINSIGHTS Analysis

ARGENTINA ARTIFICIAL INTELLIGENCE MARKET SIZE, BY HARDWARE, 2023-2030 (USD BILLION)

Hardware20232024202520262027202820292030CAGR (2023-2030)
Forecast
Mapping Devicesxxxxxxxxxxxxxxxxxx
GPS Devicesxxxxxxxxxxxxxxxxxx
Drones for Mappingxxxxxxxxxxxxxxxxxx
Source: Secondary Research, Expert Interviews, and CONSAINSIGHTS Analysis

ARGENTINA ARTIFICIAL INTELLIGENCE MARKET SIZE, BY PRODUCT, 2023-2030 (USD BILLION)

By Product20232024202520262027202820292030CAGR (2023-2030)
Forecast
Softwarexxxxxxxxxxxxxxxxxx
Hardwarexxxxxxxxxxxxxxxxxx
Servicesxxxxxxxxxxxxxxxxxx
Source: Secondary Research, Expert Interviews, and CONSAINSIGHTS Analysis

ARGENTINA ARTIFICIAL INTELLIGENCE MARKET SIZE, BY SERVICES, 2023-2030 (USD BILLION)

Services20232024202520262027202820292030CAGR (2023-2030)
Forecast
Consulting Servicesxxxxxxxxxxxxxxxxxx
Mapping and Analysis Servicesxxxxxxxxxxxxxxxxxx
Maintenance and Support Servicesxxxxxxxxxxxxxxxxxx
Source: Secondary Research, Expert Interviews, and CONSAINSIGHTS Analysis

ARGENTINA ARTIFICIAL INTELLIGENCE MARKET SIZE, BY APPLICATION, 2023-2030 (USD BILLION)

By Application20232024202520262027202820292030CAGR (2023-2030)
Forecast
Transportationxxxxxxxxxxxxxxxxxx
Urban Planningxxxxxxxxxxxxxxxxxx
Real Estatexxxxxxxxxxxxxxxxxx
Disaster Managementxxxxxxxxxxxxxxxxxx
Agriculturexxxxxxxxxxxxxxxxxx
Tourismxxxxxxxxxxxxxxxxxx
Other Applicationsxxxxxxxxxxxxxxxxxx
Source: Secondary Research, Expert Interviews, and CONSAINSIGHTS Analysis

CHILE ARTIFICIAL INTELLIGENCE MARKET SIZE, BY PRODUCT, 2023-2030 (USD BILLION)

By Product20232024202520262027202820292030CAGR (2023-2030)
Forecast
Softwarexxxxxxxxxxxxxxxxxx
Hardwarexxxxxxxxxxxxxxxxxx
Servicesxxxxxxxxxxxxxxxxxx
Source: Secondary Research, Expert Interviews, and CONSAINSIGHTS Analysis

CHILE ARTIFICIAL INTELLIGENCE MARKET SIZE, BY SOFTWARE, 2023-2030 (USD BILLION)

Software20232024202520262027202820292030CAGR (2023-2030)
Forecast
Mapping Softwarexxxxxxxxxxxxxxxxxx
Navigation Softwarexxxxxxxxxxxxxxxxxx
Geo-analytics Softwarexxxxxxxxxxxxxxxxxx
Source: Secondary Research, Expert Interviews, and CONSAINSIGHTS Analysis

CHILE ARTIFICIAL INTELLIGENCE MARKET SIZE, BY PRODUCT, 2023-2030 (USD BILLION)

By Product20232024202520262027202820292030CAGR (2023-2030)
Forecast
Softwarexxxxxxxxxxxxxxxxxx
Hardwarexxxxxxxxxxxxxxxxxx
Servicesxxxxxxxxxxxxxxxxxx
Source: Secondary Research, Expert Interviews, and CONSAINSIGHTS Analysis

CHILE ARTIFICIAL INTELLIGENCE MARKET SIZE, BY HARDWARE, 2023-2030 (USD BILLION)

Hardware20232024202520262027202820292030CAGR (2023-2030)
Forecast
Mapping Devicesxxxxxxxxxxxxxxxxxx
GPS Devicesxxxxxxxxxxxxxxxxxx
Drones for Mappingxxxxxxxxxxxxxxxxxx
Source: Secondary Research, Expert Interviews, and CONSAINSIGHTS Analysis

CHILE ARTIFICIAL INTELLIGENCE MARKET SIZE, BY PRODUCT, 2023-2030 (USD BILLION)

By Product20232024202520262027202820292030CAGR (2023-2030)
Forecast
Softwarexxxxxxxxxxxxxxxxxx
Hardwarexxxxxxxxxxxxxxxxxx
Servicesxxxxxxxxxxxxxxxxxx
Source: Secondary Research, Expert Interviews, and CONSAINSIGHTS Analysis

CHILE ARTIFICIAL INTELLIGENCE MARKET SIZE, BY SERVICES, 2023-2030 (USD BILLION)

Services20232024202520262027202820292030CAGR (2023-2030)
Forecast
Consulting Servicesxxxxxxxxxxxxxxxxxx
Mapping and Analysis Servicesxxxxxxxxxxxxxxxxxx
Maintenance and Support Servicesxxxxxxxxxxxxxxxxxx
Source: Secondary Research, Expert Interviews, and CONSAINSIGHTS Analysis

CHILE ARTIFICIAL INTELLIGENCE MARKET SIZE, BY APPLICATION, 2023-2030 (USD BILLION)

By Application20232024202520262027202820292030CAGR (2023-2030)
Forecast
Transportationxxxxxxxxxxxxxxxxxx
Urban Planningxxxxxxxxxxxxxxxxxx
Real Estatexxxxxxxxxxxxxxxxxx
Disaster Managementxxxxxxxxxxxxxxxxxx
Agriculturexxxxxxxxxxxxxxxxxx
Tourismxxxxxxxxxxxxxxxxxx
Other Applicationsxxxxxxxxxxxxxxxxxx
Source: Secondary Research, Expert Interviews, and CONSAINSIGHTS Analysis

16 Company Profiles

Google Maps - Company Profile
Apple Maps - Company Profile
HERE Technologies - Company Profile
TomTom - Company Profile
Mapbox - Company Profile
OpenStreetMap - Company Profile
Esri - Company Profile
Trimble - Company Profile
Waze - Company Profile
Navteq - Company Profile
Carto - Company Profile
MapQuest - Company Profile
Bing Maps - Company Profile
Supermap - Company Profile
Yext - Company Profile
Citrix

Carmax - Company Profile

Siemens Profile Overview

About siemens

Siemens is a global powerhouse in electronics and electrical engineering, operating in industry, energy, healthcare, and infrastructure & cities. The company is a leading provider of technologies that drive the world of tomorrow, with innovative solutions for sustainable energy, intelligent infrastructure, and digitalization. With a presence in over 200 countries, Siemens is committed to shaping a more intelligent and sustainable future for all.

siemens Executives

  • Roland Busch - President and CEO
  • Maria Ferraro - CFO
  • Judith Wiese - CMO

siemens Locations and Subsidiaries

  • Headquarters: Munich, Germany
  • Subsidiaries: Siemens Healthineers, Siemens Energy, Siemens Mobility

siemens Business Segments

  • Digital Industries
  • Smart Infrastructure
  • Mobility
  • Healthineers
  • Siemens Energy

What’s included in this siemens company profile report?

  • 1. company

    Siemens

  • 2. financials

    Detailed financial analysis including revenue, profit margins, and growth trends.

  • 3. competitors

    Major competitors include General Electric, ABB, and Schneider Electric.

  • 4. swot Analysis

    SWOT analysis highlighting Siemens's strengths in innovation and global presence, as well as opportunities in renewable energy and threats from geopolitical factors.

  • 5. growth Factors

    Key growth factors include digitalization, sustainability solutions, and the expansion of smart infrastructure.

  • 6. hiring Strategy

    Siemens's hiring strategy focuses on recruiting top talent in engineering, technology, and project management.

  • 7. business Strategy

    Overview of Siemens's business strategies, including partnerships for sustainable development, digital transformation initiatives, and investment in R&D.

  • 8. key Business Areas

    Focus areas include automation, electrification, and industrial software.

  • 9. digital Ads Strategy

    Overview of Siemens's digital advertising strategies, including targeted campaigns, thought leadership content, and social media engagement.

  • 10. competition Analysis

    Analysis of the competitive landscape in the technology and engineering industry, highlighting Siemens's market positioning and differentiation strategies.

  • 11. social Media Listening

    Insights from social media listening reports on customer feedback, trends in technology adoption, and brand reputation.

17 Competitive Landscape

Market Share Analysis
Competitive Landscape
Mergers and Acquisitions
Market Growth Strategies

Market Share Analysis

The digital map market has witnessed substantial growth in recent years, driven by advancements in technology and increased demand for geospatial data applications. Various players have established their presence, leading to a market characterized by competitive dynamics. Market share analysis provides valuable insights into the leading companies, their strategies, and their influence on market trends and developments.

Currently, some of the most significant players include Google, ESRI, and HERE Technologies, which have managed to capture a large share of the market through innovative mapping solutions and user-friendly interfaces. Google Maps, in particular, has gained dominance due to its extensive user base and continuous updates that integrate AI and machine learning, enhancing overall user experience.

Furthermore, traditional mapping companies are adapting their business models to stay relevant. Companies like MapQuest and OpenStreetMap have transitioned from physical map publishing to offering digital solutions, striving to carve out niches by emphasizing unique features such as user-generated content or specialized mapping for specific industries.

Although large corporations hold significant market share, there is also a rising trend among small and medium-sized enterprises (SMEs) that focus on niche markets. These companies often leverage targeted marketing strategies and innovative technology to provide tailored solutions that cater to specific customer needs, contributing to a more fragmented but diversified market landscape.

Overall, the digital map market remains competitive, with shifting market share driven by technological advancements, changing consumer preferences, and strategic positioning by key industry players.

Competitive Landscape

The competitive landscape of the digital map market is dynamic and ever-evolving, influenced by rapid technological advancements and changing customer requirements. This environment includes a mix of established players, innovative start-ups, and emerging tech companies, all vying for market share and customer loyalty through differentiation and value-added services.

Leading companies have focused on integrating advanced technologies such as Artificial Intelligence (AI), Machine Learning (ML), and Augmented Reality (AR) into their offerings. For instance, Google has leveraged its vast data resources to create sophisticated algorithms that optimize routing and provide real-time traffic updates, setting a benchmark for others in the industry. Similarly, companies like HERE and ESRI have pioneered solutions in spatial analytics and cartography that cater to specific sectors like logistics and urban planning.

In addition to technology adoption, these companies have established strategic partnerships to enhance their capabilities and service offerings. Collaborations with automotive companies for in-car navigation systems, partnerships with tech firms for improved analytics, and affiliations with academic institutions for research innovations illustrate a trend towards synergistic growth and knowledge sharing.

However, the market is also witnessing the rise of start-ups that focus on niche applications such as indoor mapping, navigation for visually impaired users, and specialized maps for various industries, which adds layers of competition. These new players often leverage agile methodologies and innovative coding practices, leading to unique solutions that address specific problems, thus challenging traditional incumbents.

Consequently, the competitive landscape is marked by both rivalry and collaboration. Companies must remain vigilant about emerging technologies, consumer behavior shifts, and competitive moves, making strategic decisions critical for sustained growth and market leadership.

Mergers and Acquisitions

Mergers and acquisitions (M&A) have become a prevalent strategy within the digital map market, as companies seek to enhance their technological capabilities and expand their market reach. These strategic moves are often driven by the desire to leverage complementary strengths, acquire innovative technologies, and access new customer bases.

Recent years have seen several notable acquisitions that have reshaped the competitive landscape. For example, Google’s acquisition of various mapping and location-based service firms demonstrates its intention to bolster its dominance and integrate advanced functionalities into its services. Such acquisitions not only enhance Google’s technical capabilities but also enrich its data offerings, further solidifying its position in the market.

Similarly, HERE Technologies has engaged in strategic acquisitions aimed at enhancing its mapping solutions for various sectors, including automotive and logistics. By integrating specialized technologies from acquired companies, HERE can provide comprehensive mapping solutions tailored to the specific demands of different industries, thereby gaining a competitive advantage.

Another strategic trend involves partnerships between traditional tech firms and emerging startups. These collaborations allow established companies to tap into innovative solutions while providing startups with necessary resources and market access. For example, partnerships focused on smart city initiatives often combine mapping technologies with IoT solutions to create comprehensive urban development strategies.

In conclusion, M&A activities play a critical role in shaping the digital map market, allowing companies to stay competitive while driving innovation and enhancing their service portfolios. The efficacy of these strategies will primarily depend on the companies' ability to integrate acquired technologies and align them with their overall business objectives.

Market Growth Strategies

The continuous evolution of the digital map market necessitates strategic approaches to ensure sustained growth and market penetration. Companies are adopting various growth strategies aimed at enhancing their competitive positioning and maximizing their market reach while catering to the needs of diverse customers.

One prominent strategy involves innovation through technology development. Companies are heavily investing in research and development to create cutting-edge mapping solutions that cater to contemporary user demands. For instance, incorporating features like real-time environmental data integration, multi-modal transport options, and user-friendly interfaces are becoming essential to meet customer expectations.

Furthermore, expanding into emerging markets presents substantial growth opportunities. Companies are increasingly targeting regions with a rising need for mapping and geographic information systems, especially in developing countries where infrastructure improvements are underway. Tailoring services to meet local needs, including language customization and region-specific functionalities, is key to capturing this market segment.

Collaboration and strategic alliances also play a significant role in market growth strategies. By forming partnerships with technology providers, academic institutions, and industry leaders, companies can span the technology spectrum, from data collection to analysis and application, thus providing more comprehensive services to their clients.

Lastly, a focus on sustainability has also become an essential component of corporate strategy, with businesses looking to provide solutions that support eco-friendly initiatives and smart city development. This requires digital mapping solutions that can assist in urban planning, environmental monitoring, and resource optimization for businesses and governments alike, reflecting a growing trend towards sustainability in technological advancements.

18 Investment Analysis

Investment Opportunities in the Digital Map Market
Return on Investment (RoI) Analysis
Key Factors Influencing Investment Decisions
Investment Outlook and Future Prospects

Investment Opportunities in the Digital Map Market

The digital map market presents a plethora of investment opportunities across various sectors due to its pivotal role in decision-making and operations. With the integration of technologies such as artificial intelligence (AI), machine learning, and the Internet of Things (IoT), investors can explore various avenues, including smart city planning, autonomous vehicles, and location-based services. Each of these areas not only demands sophisticated mapping solutions but also showcases a growing market for entrepreneurs and businesses willing to innovate.

Smart cities are at the forefront of urban planning initiatives, looking to optimize resources and improve the quality of life for residents. As municipalities worldwide pioneer smart city frameworks, the demand for digital mapping solutions to monitor traffic flows, public transport routes, and efficient energy distribution is soaring. Investors can align with startups and established players offering integrated mapping solutions designed to support urban trends, ultimately leading to significant investment returns.

Another lucrative opportunity stems from the rise of autonomous vehicles. Major automakers and tech firms are pouring billions into research and development to create self-driving capabilities, significantly enhanced by high-quality digital mapping. Investments in companies developing precise mapping technologies, capable of providing real-time data about drivers' surroundings, bear the potential for huge long-term gains as the autonomous vehicle market expands.

Location-based services (LBS) constitute yet another promising investment vertical within the digital map landscape. With growing reliance on smartphones and mobile applications, businesses that can capitalize on geolocation to enhance customer experiences—through custom advertising, navigation aids, or logistics optimization—are in high demand. Investing in firms focused on improving LBS can yield fruitful results as consumers continue to embrace mobile tech.

Moreover, the surge in e-commerce has prompted retailers to seek innovative ways to enhance delivery systems and customer engagement via digital mapping technologies. By investing in platforms that optimize logistics through route mapping or customer engagement strategies that utilize AI-driven data analysis, stakeholders can find substantial opportunities in this increasingly digital and consumer-focused marketplace.

Return on Investment (RoI) Analysis

Understanding the return on investment (RoI) in the digital map market is crucial for stakeholders aiming to make informed investment choices. The RoI in this industry tends to depend on various parameters, including technological advancements, consumer adaptation, and the market size of applications relying on digital mapping technologies. Investors should consider the strategic positioning of their investments and the longevity of the technology involved to gauge potential returns accurately.

Investments targeting innovative startups in the digital mapping sector can yield high returns, especially if the chosen company introduces groundbreaking technologies or captures niche markets. The dynamic nature of the industry means that early-stage investments, although riskier, often translate into significant profits when successful. Therefore, savvy investors frequently conduct thorough due diligence, analyzing market trends and competitive landscapes to minimize risks while maximizing potential RoI.

Additionally, established players in the digital map market often offer more stable investment opportunities with predictable RoI due to their long-standing presence and proven business models. Conversely, investing in such companies might yield lower returns compared to the potential rewards from startups. However, the established firms typically have better financial resources, more resilient revenue streams, and diversified portfolios, which contribute to steady returns over time.

To enhance the RoI from digital map investments, stakeholders are increasingly focusing on collaboration. The synergy between various industry players—companies that specialize in AI, IoT, and data analytics—can optimize returns significantly. By investing not just in mapping solutions but also in complementary technologies, investors can leverage synergies that enhance the value proposition of their investments.

Ultimately, the RoI in the digital map market is influenced by the continuous evolution of technology and consumer expectations. Investors who are agile and adaptable will likely find that their returns correspond to their ability to pivot toward emerging trends and market demands, thereby maximizing their investment outcomes in this exciting space.

Key Factors Influencing Investment Decisions

Investment decisions in the digital map market are influenced by a multitude of factors, ranging from technological advancements to regulatory environments and competitive dynamics. One major consideration is the pace of technological innovation. As the market shifts towards more advanced mapping solutions like 3D mapping, AI integration, and real-time data updates, investors are more inclined to back companies offering cutting-edge solutions. The ability of a company to stay ahead with technology often serves as a crucial differentiator in investment decisions.

Regulatory factors also play a substantial role in shaping the investment landscape. Privacy laws and data protection regulations can heavily influence maps and spatial data utilization. Investors must remain cognizant of how regulatory frameworks differ across regions, which can impact the feasibility and profitability of digital mapping solutions. Understanding these varying laws can help investors mitigate risks associated with legal compliance.

Market competition is another critical factor that affects investment decisions. Investors often analyze the competitive landscape to identify key players, their market shares, and the unique value propositions that differentiate them. Competitive advantages can stem from proprietary algorithms, unique partnerships, or superior customer engagement strategies. A thorough assessment of the competitive environment can guide investors toward opportunities with higher growth potential and lower competitive risks.

Moreover, market demand and consumer behavior play a pivotal role in shaping investment strategies. The increasing need for efficient logistics, navigation, and location-based services signifies a robust market for digital maps. Investors should observe consumer trends and preferences, ensuring that their investment targets align with prevailing market demands and exhibit the potential for growth.

Lastly, financial stability and performance metrics of companies in the digital map industry are critical for informed investment decisions. Factors like revenue growth, profitability ratios, and R&D spending often indicate a company’s capacity for innovation and market adaptability. By evaluating these financial metrics, investors can gauge which companies are more likely to succeed and offer substantial returns on their investments.

Investment Outlook and Future Prospects

The future outlook for investments in the digital map market is robust, driven by continuous technological advancements and evolving consumer needs. Predictions suggest that the demand for digital mapping solutions will only increase, propelled by trends like urbanization, environmental sustainability, and the proliferation of smart technologies. This trajectory indicates a favorable environment for both new and existing investors looking to capitalize on the shifting landscape.

Emerging technologies are set to redefine the digital mapping space significantly. The introduction of enhanced geographic information systems (GIS) will revolutionize how maps are created and utilized across sectors including agriculture, urban development, and emergency management. Investors who keep an eye on companies that innovate in these areas will likely find fertile ground for investment.

Furthermore, the integration of augmented reality (AR) and virtual reality (VR) into mapping solutions is anticipated to create exciting new applications. These technologies enhance user interactions with spatial data, opening up new realms for investment—which can appeal to tech-savvy consumers and businesses alike. As these technologies mature, early investments could yield substantial returns as they become mainstream.

Investments in sustainability initiatives are also projected to gain traction as businesses rush to adopt practices that support environmental conservation. Digital mapping solutions that assist in monitoring climate change, urban pollution, and land use changes will find a significant market. Investors focused on sustainability will not only potentially benefit from profitable opportunities but also contribute positively to societal and environmental goals.

Finally, as the digital map market expands, so does the interconnectedness of industries and sectors. Collaboration among tech firms, governments, and research institutions is expected to foster innovation and growth, paving the way for more substantial investment opportunities. The outlook indicates that those who engage in strategic partnerships and collaborations will be well-placed to seize opportunities across the rapidly evolving digital map landscape.

19 Strategic Recommendations

Market Entry Strategies for New Players
Expansion and Diversification Strategies for Existing Players
Product Development and Innovation Strategies
Collaborative Strategies and Partnerships
Marketing and Branding Strategies
Customer Retention and Relationship Management Strategies

Market Entry Strategies for New Players

Entering the digital map market requires clarity on one’s unique selling proposition (USP). New players should focus on developing a niche offering that addresses specific needs such as local navigation, tourism, or augmented reality (AR) mapping. A thorough market analysis identifying existing competitors and gaps in the market is essential. Specializing in a unique domain can set a newcomer apart from the saturation of generic map providers.

Building a robust technology infrastructure is critical. New entrants should invest in scalable technology platforms that allow for quick updates and adaptations. Focusing on utilizing cloud-based services can facilitate efficient data management and processing. By ensuring that the technology is agile and capable of incorporating new data streams, new entrants can maintain accuracy and relevance in their offerings.

Leveraging partnerships with local businesses can be highly beneficial. Collaborating with regional companies that understand the local geography and user preferences can lead to more tailored map products. Such partnerships not only provide valuable insights but can also enhance market entry speed through shared resources and audiences.

Marketing is an essential component when entering a new market. New players should consider targeted digital marketing campaigns to create awareness of their products. Utilizing social media and online advertising can effectively reach potential users. Effective storytelling about the service’s benefits can resonate with the target audience, leading to increased adoption rates.

Lastly, regulatory compliance must be at the forefront of market entry strategies. Understanding local laws related to data privacy, geographical data use, and digital services is crucial. New players should ensure that their practices are compliant to avoid legal challenges, which would hinder growth and market presence.

Expansion and Diversification Strategies for Existing Players

Existing players in the digital map market can explore various strategies for expansion and diversification. This includes geographical expansion into underserved regions. By assessing the digital map needs in international markets or rural areas, businesses can tailor their offerings to meet local demands, thereby gaining a competitive edge and increasing market share.

Diversifying service offerings is another effective strategy. Companies can enhance their product lines by integrating features such as real-time traffic updates, public transport information, or geolocation services to enhance user experience. By providing comprehensive mapping solutions that address diverse user needs, these players can attract a wider audience and increase customer loyalty.

Investing in technological advancements is crucial as well. Existing players should continually update and refine their mapping technologies to stay ahead of competitors. This could involve adopting AI and machine learning for predictive analytics in navigation or enhancing visualization tools for better user interaction. Such innovations can significantly improve the value proposition of existing services.

Acquisitions offer another growth pathway. Existing companies could consider acquiring smaller, innovative firms specializing in specific map technologies or underexploited market segments. This not only expands their product capabilities but also helps assimilate new talent that can bring fresh perspectives and innovations to the table.

Finally, fostering customer engagement through community-driven initiatives can aid in both expansion and retention. Encouraging users to provide feedback or contribute to map accuracy can lead to improved services and strengthen community relationships. Such efforts can make existing players more resilient in the competitive landscape of digital mapping.

Product Development and Innovation Strategies

Successful product development in the digital map market hinges on understanding user needs through data analysis. Conducting in-depth market research to grasp user behaviors, preferences, and pain points is crucial. Such insights should inform the development of map features that cater to specific user segments, leading to enhanced usability and satisfaction.

Incorporating user feedback into the development process can lead to innovative solutions that resonate with target audiences. Establishing communication channels, like surveys or beta testing groups, allows users to share experiences and suggestions, guiding the iterative design of product features. Keeping users involved from the beginning helps in ensuring the product meets their expectations and increases the likelihood of adoption.

Another important aspect is investing in cutting-edge technologies. For instance, integrating 3D mapping and virtual reality features can significantly elevate the user experience. The development of smart algorithms for personalized routing and location recommendations can enhance functionality and user interactivity. Keeping pace with technological trends will ensure that products remain competitive and relevant in a rapidly evolving market.

Additionally, focusing on sustainability can spur innovation. There is an increasing demand for eco-friendly mapping options, such as those highlighting sustainable transport routes or promoting carbon footprint-conscious choices. Developing features that align with such sustainability goals can attract environmentally aware consumers and enhance brand image.

Finally, establishing a culture of continuous learning and adaptation within the organization promotes innovation. Providing training and resources for staff to experiment with new ideas and tools fosters an environment that encourages creative problem-solving and product improvement that meets market needs.

Collaborative Strategies and Partnerships

Collaborative strategies are pivotal in the digital map sector, allowing companies to leverage collective strengths to enhance their offerings. Forming strategic partnerships with tech firms specializing in data analytics or AI can provide significant advantages. By collaborating with organizations that boast strong capabilities in these areas, map providers can gain insights and technologies that elevate their product functionalities.

Establishing partnerships with local governments or transport authorities can also enhance map accuracy and relevance. Collaborating on projects that require real-time data, such as public transport routes or emergency service access, can improve user trust and engagement. Moreover, alignment with municipal initiatives can position these companies as community-focused service providers.

Another potential partnership avenue is with businesses in complementary sectors, such as travel or real estate. By integrating mapping solutions into travel platforms or property searches, companies can extend their reach and create value-added services that meet consumer needs more comprehensively.

Additionally, engaging in partnerships with academic institutions can drive innovation. Collaborating on research projects can open new channels for product development, tapping into the latest academic findings while also providing students with practical experiences. Such collaborations can lead to pioneering technologies that reshape the digital mapping landscape.

Finally, forming alliances with content creators and local influencers can aid in marketing initiatives. By leveraging the social reach of these individuals, map services can enhance visibility and credibility in new markets. The resulting organic promotion can be instrumental in attracting new users and building brand trust.

Marketing and Branding Strategies

In the crowded digital map market, effective marketing and branding strategies are essential for differentiation. Establishing a strong brand identity that communicates the unique values and benefits of the service is crucial. This identity should resonate with the target audience and be consistent across all marketing channels.

Implementing content marketing can enhance visibility and brand authority. By creating informative content related to digital mapping—such as blog posts, videos, or infographics—companies can attract users seeking solutions. Providing educational content on navigation tips or geographic features not only builds trust but also positions the brand as a thought leader in the space.

An omnichannel marketing approach can maximize reach. Utilizing a mix of social media platforms, email marketing, and SEO-optimized content ensures that the brand message is visible throughout different touchpoints in the consumer journey. Regular engagement through these channels helps in nurturing relationships and fostering brand loyalty.

Leveraging user-generated content and testimonials can also enhance credibility. Encouraging users to share their experiences adds authenticity to the brand’s narrative. Featuring reviews and user stories on social media or the company website can create a sense of community and engage potential new users by showcasing real-life applications of the digital mapping solutions.

Finally, incentivizing referrals and offering promotions can stimulate brand growth. Creating loyalty programs or referral bonuses encourages current users to act as advocates for the brand. Such strategies not only increase user acquisition rates but deepen existing customer relationships, turning them into long-term ambassadors.

Customer Retention and Relationship Management Strategies

In the digital map market, customer retention is just as important as acquiring new users. Companies should focus on delivering exceptional user experiences to ensure customer satisfaction. This can be achieved by regularly updating the mapping features, ensuring accuracy, and promptly addressing any user concerns or needs.

Implementing a customer relationship management (CRM) system can aid companies in tracking and analyzing user behaviors. Such insights help in personalizing interactions and tailoring offers to meet specific user preferences. Through segmented marketing communications, companies can foster a sense of belonging and relevance among users.

Engaging customers through regular communication is fundamental. Creating newsletters or notifications about product updates or new features keeps users informed and invested in the brand. This proactive approach can diminish churn rates and encourage continued use of services.

Offering loyalty rewards can incentivize long-term usage. By recognizing loyal customers with exclusive features, discounts, or early access to new products, companies can foster a strong sense of value and appreciation, encouraging continued patronage.

Finally, establishing a robust feedback loop with users fosters a community feeling. Regularly collecting user feedback and implementing changes based on their suggestions shows that the company values their input. This two-way communication enhances user loyalty and ensures that the mapping services continually evolve to meet customer needs.