
Surgical Visualization Systems Market Report
First published: 10 October 2024 | Last updated: 28 May 2026 | Report Code: surgical-visualization-systems
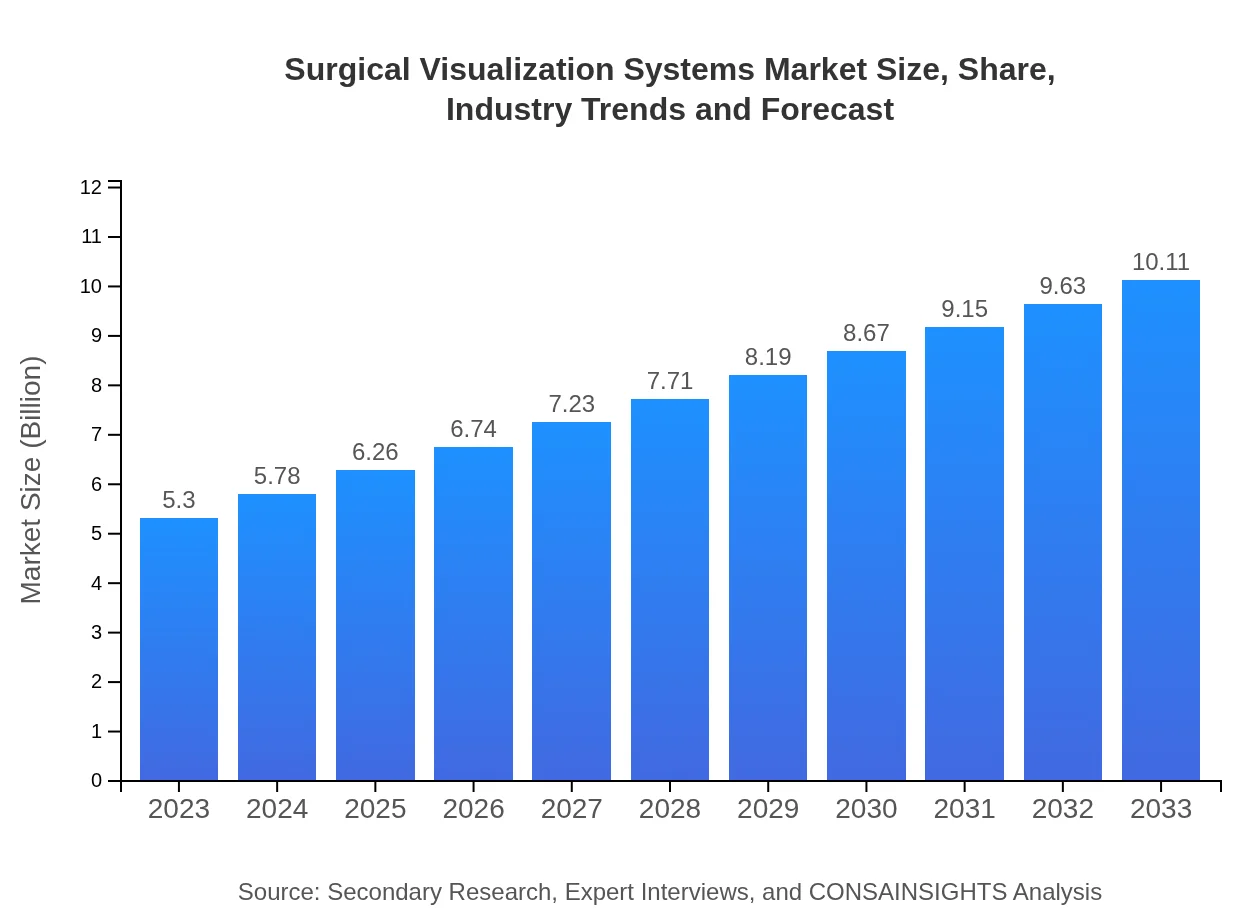
Surgical Visualization Systems Market — USD 5.3 billion in 2023, Growing to USD 10.11B by 2033 at 6.5% CAGR
This report provides an in-depth analysis of the Surgical Visualization Systems market, covering trends, opportunities, market size, and forecasts from 2023 to 2033. Insights include market segmentation by technology and application areas, alongside regional performance and key players in the industry.
Key Takeaways
- Global market expands from $5.30 Billion in 2023 to $10.11 Billion in 2033 at a 6.5% CAGR.
- North America is largest regional market, while no single fastest-growing region is stated because regional CAGR differences remain within 0.15 percentage points.
- Europe grows from $1.67 Billion in 2023 to $3.18 Billion in 2033, reflecting significant adoption of advanced imaging.
- Top vendors include Stryker Corporation, Olympus Corporation, Medtronic, Karl Storz and GE Healthcare.
- Key segments include hardware components, software solutions, support and maintenance, and end-users such as hospitals and ambulatory surgery centers.
Surgical Visualization Systems Market Report — Executive Summary
North America remains largest market by forecast-period value, while no single fastest-growing region is stated because top regional growth rates are separated by less than 0.15 percentage points. The Surgical Visualization Systems Market Report analyzes the market as it grows from $5.30 Billion in 2023 to $10.11 Billion by 2033 at a 6.5% CAGR. Growth is supported by increasing use of minimally invasive techniques, rising healthcare spending, and ongoing innovations in 2D, 3D and augmented reality-enabled visualization. The report examines product and technology segmentation—hardware components, software solutions and services—alongside end-user categories such as hospitals, ambulatory surgery centers and clinics. Regional chapters present 2023–2033 trajectories for North America, Europe, Asia Pacific, Latin America and Middle East & Africa, with North America identified as the largest market. Competitive coverage profiles major players including Stryker Corporation, Olympus Corporation, Medtronic, Karl Storz and GE Healthcare. Methodology combines expert interviews, company disclosures and data triangulation to validate findings and highlight actionable trends for manufacturers, providers and investors.
Key Growth Drivers
- Rising preference for minimally invasive procedures pushes demand for enhanced visualization tools and related hardware.
- Technological progress in 3D imaging and augmented reality expands clinical applications and training uses.
- Greater healthcare expenditure and an aging population increase surgical volumes, supporting system adoption.
- Shift toward outpatient and ambulatory care settings raises need for compact, integrated visualization solutions.
- Partnerships between device makers and healthcare providers accelerate product development and clinical integration.
| Metric | Value |
|---|---|
| Study Period | 2023 - 2033 |
| 2023 Market Size | $5.30 Billion |
| CAGR (2023-2033) | 6.5% |
| 2033 Market Size | $10.11 Billion |
| Top Companies | Stryker Corporation, Olympus Corporation, Medtronic , Karl Storz, GE Healthcare |
| Published Date | 10 October 2024 |
| Last Modified Date | 28 May 2026 |
Surgical Visualization Systems Market Overview
Customize Surgical Visualization Systems Market Report market research report
- ✔ Get in-depth analysis of Surgical Visualization Systems market size, growth, and forecasts.
- ✔ Understand Surgical Visualization Systems's regional dynamics and industry-specific trends.
- ✔ Identify potential applications, end-user demand, and growth segments in Surgical Visualization Systems
What is the Market Size & CAGR of Surgical Visualization Systems Market Report market in 2023?
Surgical Visualization Systems Industry Analysis
Surgical Visualization Systems Market Segmentation and Scope
Tell us your focus area and get a customized research report.
Surgical Visualization Systems Market Report Market Analysis Report by Region
Europe Surgical Visualization Systems Market Report:
Europe grows from $1.67 Billion in 2023 to $3.18 Billion in 2033. Regional growth reflects investments in digital imaging, increasing minimally invasive procedures and clinical adoption of 2D, 3D and augmented reality visualization technologies.Asia Pacific Surgical Visualization Systems Market Report:
Asia Pacific grows from $1.02 Billion in 2023 to $1.94 Billion in 2033. Expansion is supported by rising healthcare expenditure, growing surgical volumes and increasing interest in modern visualization platforms and training solutions.North America Surgical Visualization Systems Market Report:
North America is largest regional market, rising from $1.76 Billion in 2023 to $3.35 Billion in 2033. As the largest regional market, adoption is driven by extensive healthcare spending, rapid uptake of advanced imaging and integration of visualization tools into surgical practice.South America Surgical Visualization Systems Market Report:
Latin America grows from $0.52 Billion in 2023 to $1 Billion in 2033. Market movement is influenced by broader adoption of minimally invasive techniques, growing need for surgical infrastructure and gradual uptake of advanced visualization systems.Middle East & Africa Surgical Visualization Systems Market Report:
Middle East and Africa grows from $0.33 Billion in 2023 to $0.64 Billion in 2033. Growth factors include increasing healthcare investment, emphasis on improved surgical outcomes and growing use of imaging technologies in clinical settings.Tell us your focus area and get a customized research report.
Research Methodology
Surgical Visualization Systems Market Analysis By Technology
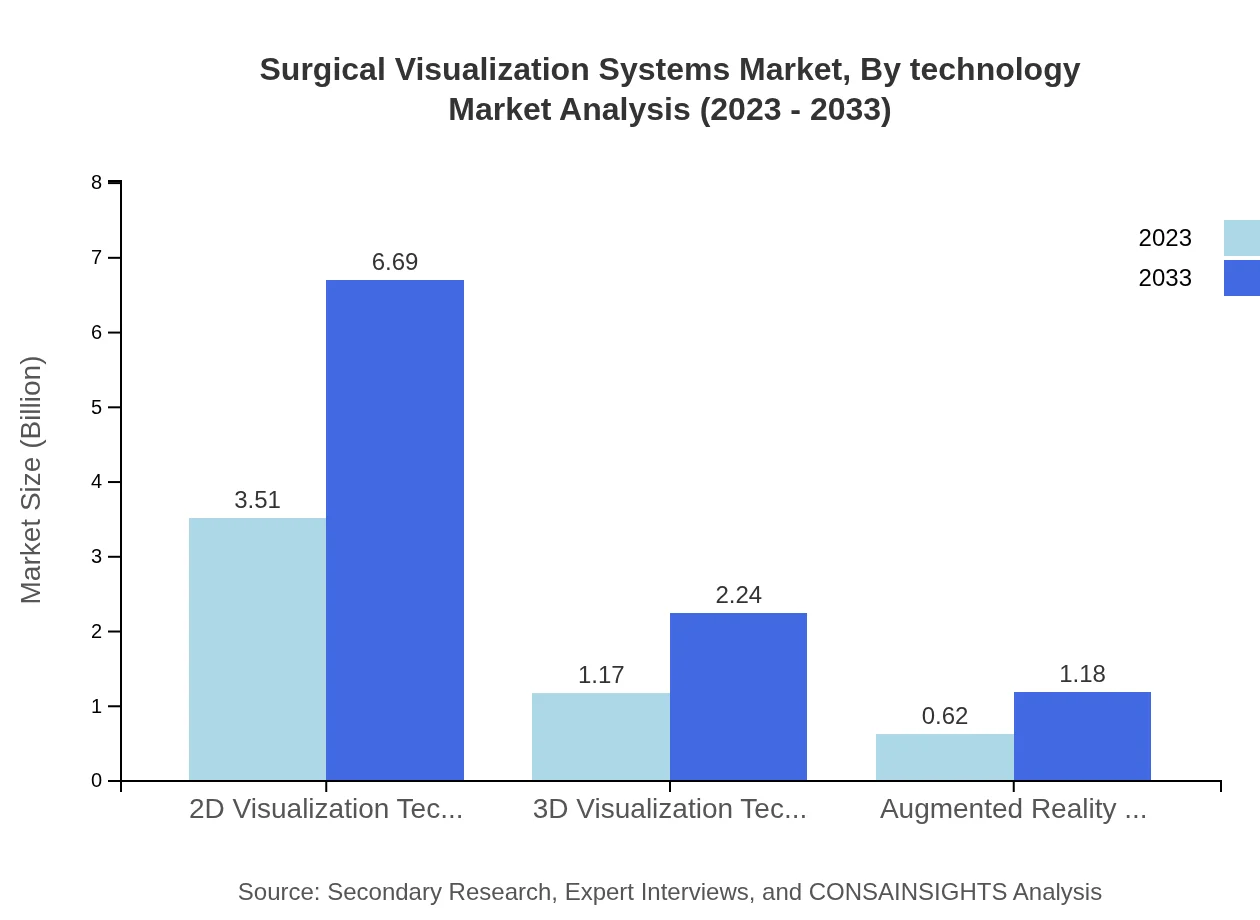
The technological segmentation includes hardware components such as imaging devices, visualization systems, and software solutions. As of 2023, hardware components dominate the market with a size of USD 3.51 billion, accounting for approximately 66.16% of the total market share. Software solutions hold a market size of USD 1.17 billion, while support and maintenance services are valued at USD 0.62 billion. By 2033, hardware systems are projected to reach USD 6.69 billion, software solutions USD 2.24 billion, and support services USD 1.18 billion.
Surgical Visualization Systems Market Analysis By Application Area
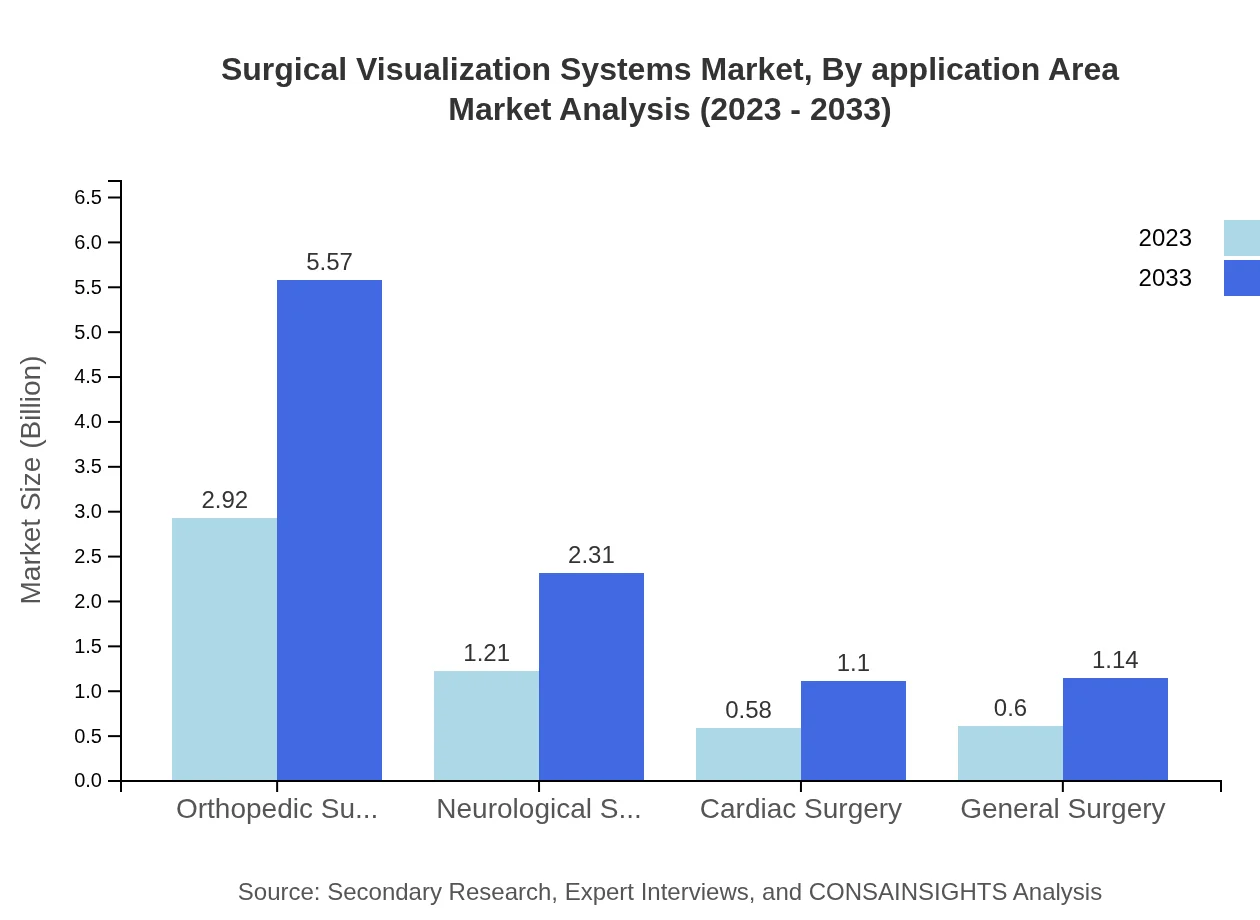
Application segments for Surgical Visualization Systems include orthopedic surgery, neurological surgery, cardiac surgery, and general surgery. Orthopedic surgery is the leading segment, with a market size of USD 2.92 billion in 2023, holding 55.09% of the market share. Neurological surgery accounts for USD 1.21 billion (22.81% share), while cardiac surgery and general surgery comprise USD 0.58 billion (10.86% share) and USD 0.60 billion (11.24% share), respectively. By 2033, orthopedic surgery is expected to grow to USD 5.57 billion, neurological to USD 2.31 billion, cardiac to USD 1.10 billion, and general surgery to USD 1.14 billion.
Surgical Visualization Systems Market Analysis By End User

End-user segmentation includes hospitals, ambulatory surgery centers, and clinics. Hospitals dominate with a market size of USD 3.51 billion, equating to 66.16% of the total market share in 2023, while ambulatory surgery centers and clinics hold market sizes of USD 1.17 billion (22.13% share) and USD 0.62 billion (11.71% share) respectively. Forecasts indicate that by 2033, these figures will rise to USD 6.69 billion for hospitals, USD 2.24 billion for ambulatory centers, and USD 1.18 billion for clinics.
Surgical Visualization Systems Market Analysis By Region

Regional analysis highlights varying market dynamics, with hardware components as the main driver across all regions. North America leads in terms of market share, especially in advanced surgical technologies. Europe shows a strong inclination towards safety-focused surgical systems, while growth in Asia Pacific is fueled by enhancements in healthcare infrastructure. South America is catching up with its demand for better surgical outcomes, while the Middle East and Africa are witnessing gradual increases in healthcare investments that support the adoption of surgical visualization technology.
Surgical Visualization Systems Market Trends and Future Forecast
Tell us your focus area and get a customized research report.
Global Market Leaders and Top Companies in Surgical Visualization Systems Industry
Stryker Corporation:
Stryker is a leader in innovative medical technologies, including surgical visualization, with a focus on improving procedural outcomes through advanced imaging and visualization systems.Olympus Corporation:
Olympus specializes in developing high-quality visualization and imaging technologies for minimally invasive surgeries and endoscopic procedures.Medtronic :
Medtronic provides comprehensive surgical solutions, including visualization systems that enhance surgical precision and outcomes.Karl Storz:
Karl Storz is recognized for its pioneering work in endoscopy and surgical imaging, contributing significantly to the advancement of surgical visualization technologies.GE Healthcare:
GE Healthcare offers advanced imaging and visualization solutions, enhancing surgical planning and performance through innovation.We're grateful to work with incredible clients.


FAQs
What is the market size in 2023?
The market size in 2023 is $5.30 Billion as reported for the Surgical Visualization Systems market for that year.
What is the projected market size in 2033?
The market is projected to reach $10.11 Billion by 2033 according to the provided forecast data for the period.
What is CAGR for the forecast period?
The compound annual growth rate (CAGR) for the 2023 to 2033 forecast period is 6.5% based on the supplied market projections.
Is there a single fastest Growing region in the Surgical Visualization Systems Market Report market?
No single fastest-growing region is stated for the Surgical Visualization Systems Market Report market because the top regional implied CAGR values are within 0.15 percentage points of each other, making the ranking too close to call reliably.
Who are the top companies in this market?
Top listed companies include Stryker Corporation, Olympus Corporation, Medtronic, Karl Storz and GE Healthcare in the provided dataset.
What are the primary technology sub Segments?
Primary technology sub-segments noted are 2D visualization technologies, 3D visualization technologies and augmented reality systems.
How are end Users categorized?
End-user categories in the input include hospitals, ambulatory surgery centers and clinics as principal buyers of visualization systems.
Why is demand increasing for these systems?
Demand is rising due to increased minimally invasive procedures, technological advancements in imaging and a growing surgical caseload from aging populations.
What research methods were used?
Research incorporated primary interviews with industry experts, secondary company reports and publications, plus data triangulation and internal validation.
Which market segments are covered?
Covered segments include hardware components, software solutions and support and maintenance services across product, technology and application dimensions.