
What should a business really look for to know if they’ve hit product-market fit? While businesses often rely on gut feeling or customer praise, that’s not enough.
The aim should be to measure product-market fit with real data, not just assumptions. We would look at proven ways to track how well your product is solving a real problem for a real market. Also, you’ll learn what metrics matter, what signals to avoid, and which tools can help you stay on track.
What Is Product-Market Fit?
Product-market fit means your product is solving a real problem for a specific group of people and they truly want it. It’s the point where demand starts to grow without you pushing too hard. Customers not only use your product but also come back, tell others, and even pay for it without needing much convincing.
The term was made popular by Marc Andreessen, who said it’s when you’re in a good market with a product that can satisfy that market. In simple terms, people need it, they use it, and they value it.
You don’t reach product-market fit with one feature or a few users. It takes consistent usage, strong retention, and feedback that tells you your product is now part of the user’s routine.
For Example: Take Notion, the popular productivity tool. In its early days, it tested different user needs from web building to team collaboration.

As more people started using it daily, creating templates, and recommending it to others, the team knew they were close to product-market fit. Usage grew naturally, and the product became a go-to tool for teams and individuals alike.
Why Measuring Product-Market Fit Is Crucial
When you offer a product or service, it’s important to know whether it truly fits the market’s needs. Without this clarity, you risk building features people don’t use, spending money on the wrong marketing efforts, or scaling too early.
Let us take a look at why measuring product-market fit is essential:
-
Helps you avoid premature scaling
-
Guides product development with real user data
-
Improves customer retention and reduces churn
-
Validates your business model before heavy investments
-
Supports better marketing and positioning strategies
-
Highlights which user segments find the most value
-
Builds confidence for investors and internal teams
Core Metrics to Measure Product-Market Fit
Now that you know why measuring product-market fit is needed, let us look at how you can actually do it. You don’t need to guess as there are clear, practical metrics that can show whether your product is truly working for your target audience.
Here are some of the most reliable metrics that help you measure product-market fit with confidence.
1. Retention Rate: Are Users Sticking Around Over Time?
Retention rate tells you how many users return after their first interaction with your product. It’s one of the clearest indicators of whether your product delivers ongoing value.
Why it matters: If users drop off after signing up or buying once, it often signals weak product-market fit.
Example: Slack closely monitored user retention by team activity. They found that teams which sent over 2,000 messages were far more likely to stick around. This became their key retention benchmark.
2. Net Promoter Score (NPS): Will Users Recommend You to Others?
NPS measures how likely users are to recommend your product to others on a scale of 0 to 10.
Why it matters: A high NPS indicates that users are not only satisfied but also enthusiastic, an emotional signal that they feel you’ve solved their problem well.
Example: Dropbox grew rapidly in its early days because of high NPS and built-in referral rewards. Their users loved the product and were eager to share it with others.
3. 40% Rule (Sean Ellis Survey): Would They Miss You If You Disappeared?
This metric is based on a single question:
“How would you feel if you could no longer use this product?”
Options:
-
Very disappointed
-
Somewhat disappointed
-
Not disappointed
Why it matters: If 40% or more users say “very disappointed,” it’s a strong signal you’ve hit product-market fit.
Example: Superhuman famously used this metric before launching widely. They didn’t release the product until over 40% of surveyed users were “very disappointed.”
4. Churn Rate: Are Customers Quietly Leaving You?
Churn rate tracks the percentage of users who stop using your product or cancel subscriptions within a given period.
Why it matters: High churn means your product isn’t essential or that expectations and reality don’t match.
Example: A SaaS tool with a free trial saw good sign-ups but 60% of paid users dropped off within 2 months. After talking to users, they found the core onboarding flow was too complex. Once improved, churn dropped below 15%.
5. Activation Rate: How Many Users Reach the ‘Aha’ Moment?
Activation rate shows the percentage of users who experience the core value of your product shortly after signing up.
Why it matters: If users never get to that first meaningful interaction, they won’t stick around.
Example: Canva defines activation as when a user creates and publishes their first design. Once users do this, they’re far more likely to return and eventually upgrade.
Tools and Dashboards to Track Product-Market Fit
To check for product-market fit, you do not need to build everything from scratch or rely on guesswork. There are powerful tools and dashboards available that make it easier to track user behaviour, engagement, and feedback in real time.
Here are some of the most useful platforms you can start using today.
1. Mixpanel – Best for Product Analytics & Retention Tracking
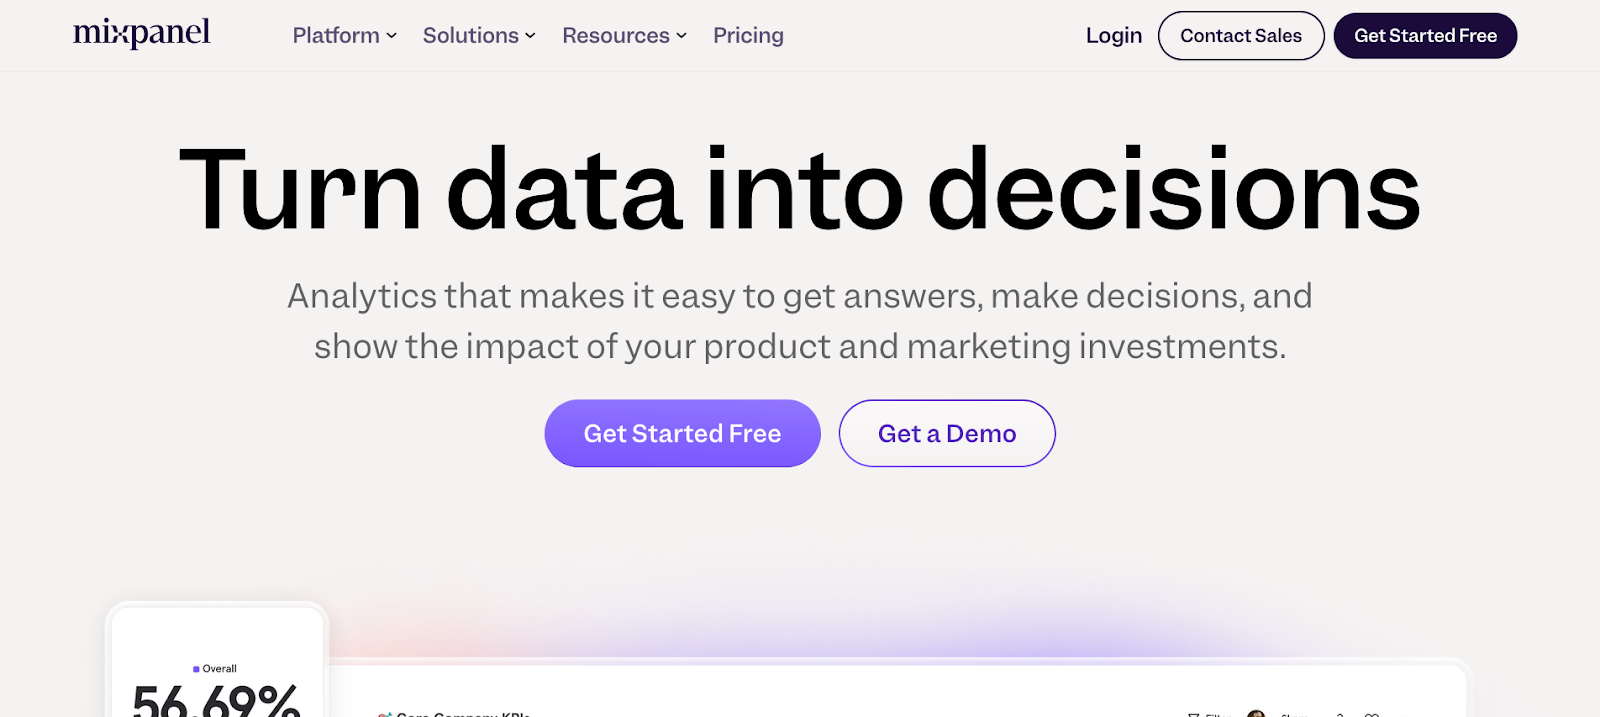
Use Case: Understand user behaviour and retention trends through event-based tracking.
Mixpanel helps product teams track user actions across web and mobile apps. You can set up custom events like signups, clicks, or feature usage to see how users engage with your product. One of its strongest features is cohort analysis—where you can track how different user groups behave over time. For example, you can create a cohort of users who signed up in May and see how many returned each week. This gives you a clear picture of retention and long-term engagement—two key indicators of product-market fit.
You can also set up funnels to track conversion through steps like onboarding → activation → subscription. The interface is intuitive, with dashboards that update in real time. It also integrates with tools like Segment, HubSpot, and Slack.
Pricing:
-
Free Plan: Up to 20M events/month
-
Growth Plan: Starts at $20/month
-
Enterprise Plan: Custom pricing
2. Typeform + Refiner – Best for Customer Surveys (e.g. 40% Rule, NPS)
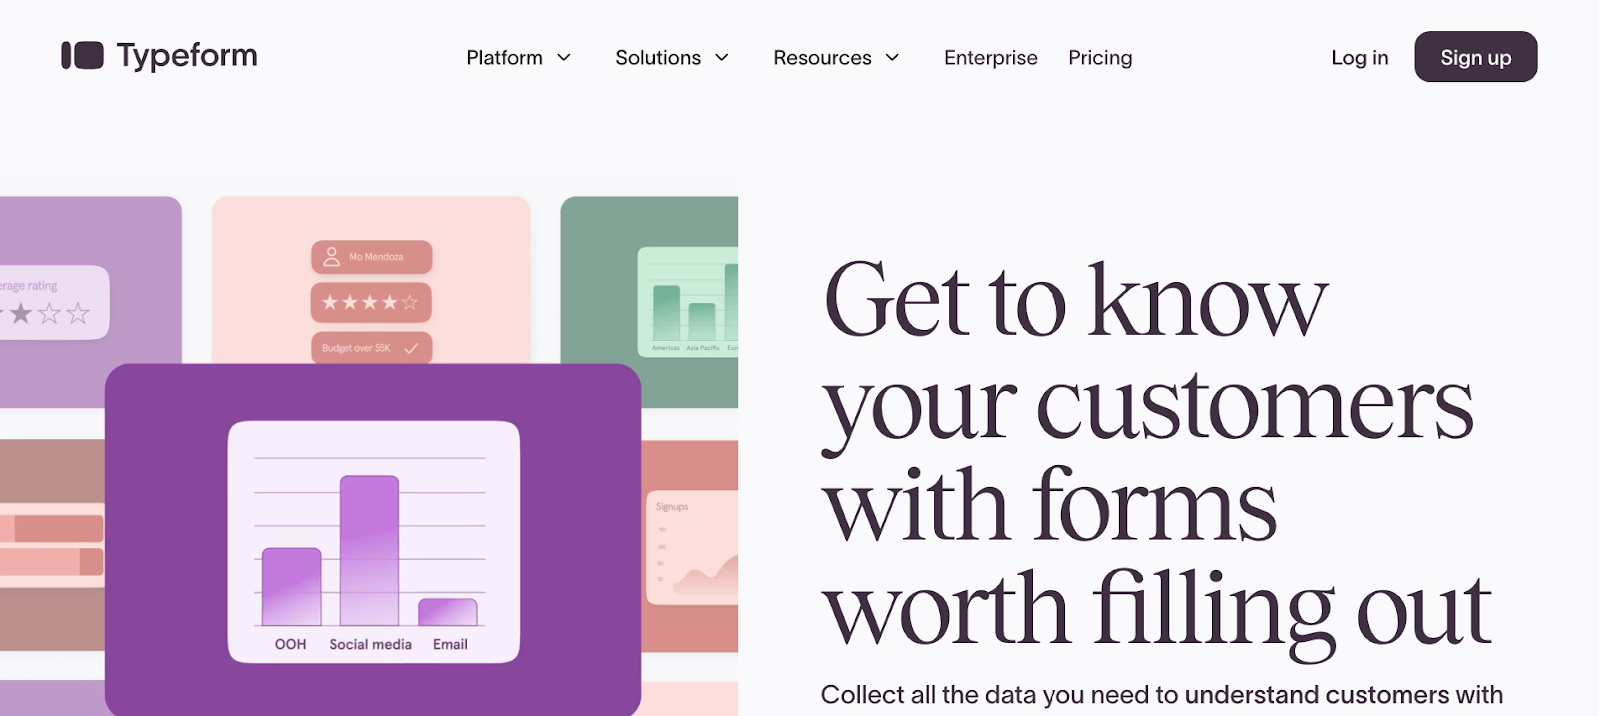
Use Case: Collect structured feedback using targeted surveys.
Typeform, paired with Refiner, is a powerful combo for measuring product-market fit through customer feedback. You can run Sean Ellis-style surveys using Typeform’s conversational forms and then manage, segment, and analyze responses in Refiner. Whether you're running an NPS survey or asking “How disappointed would you be if you could no longer use this product?”, these tools provide clean data and insights.
Refiner allows you to trigger surveys based on specific user behavior (e.g. after 5 logins), and segment results by user traits like plan type or usage frequency. It also has built-in dashboards that help you quickly see if you’ve reached that magical 40% “very disappointed” threshold.
The combination helps you collect both quantitative scores and qualitative feedback in one streamlined process, without needing to code or analyze data manually.
Pricing:
-
Typeform: Free plan available, paid plans from $25/month
-
Refiner: Starts at $79/month for up to 5,000 users tracked
3. Amplitude – Best for Product Insights & A/B Testing
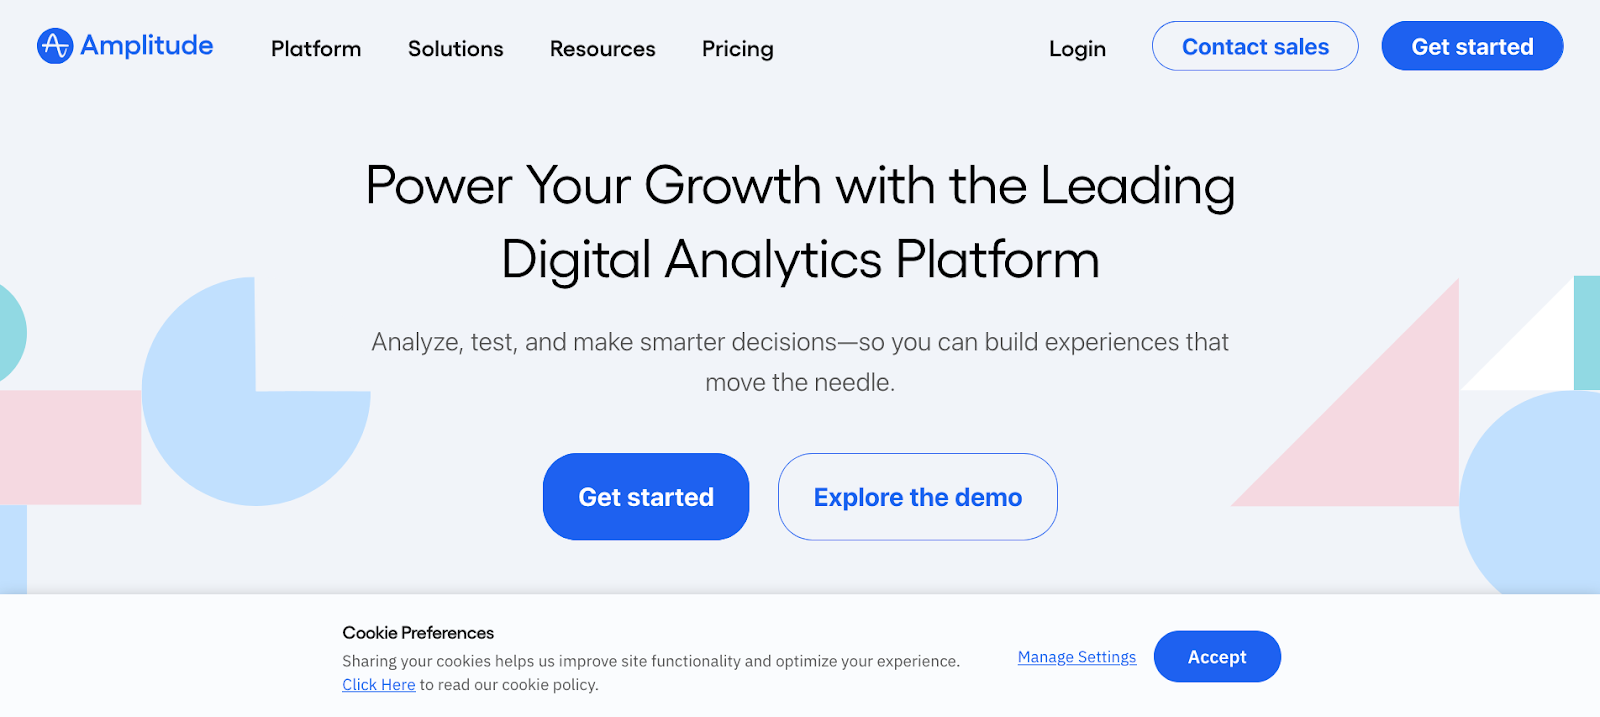
Use Case: Deep dive into feature usage, A/B test results, and user journeys.
Amplitude is another robust analytics platform that focuses on product insights. It helps teams understand how users interact with features over time. You can measure engagement with specific product features, build retention curves, and test new ideas through built-in experimentation tools.
Its “Personas” and “Pathfinder” tools show you where users drop off or what successful users do differently. This is especially useful when trying to identify your product’s "aha moment" and measure activation rate. With advanced segmentation and filters, you can isolate behaviours by device, region, or plan type to see if certain segments are closer to product-market fit than others.
Amplitude also supports data integrations with CRMs, data warehouses, and marketing tools, giving you a full view of how product and growth efforts align.
Pricing:
-
Free Plan: Available with core analytics features
-
Growth Plan: Starts at $995/year (or ~$83/month billed annually)
-
Enterprise Plan: Custom pricing based on scale
Conclusion
Measuring product-market fit isn’t about guesswork, it’s about using the right data to know what’s working and what’s not. The metrics we shared can help you make better decisions, avoid costly mistakes, and build something people truly want.
We can help you assess your product-market fit with clarity and confidence. At Consainsights, we’ve helped over 500 clients and studied more than 13,000 markets. Our data-driven approach gives you real insights into your users, competitors, and growth opportunities.
If you're serious about building a product that sticks, let’s connect.
