
Data Visualization Tools Market Report
First published: 23 September 2024 | Last updated: 31 January 2026 | Report Code: data-visualization-tools
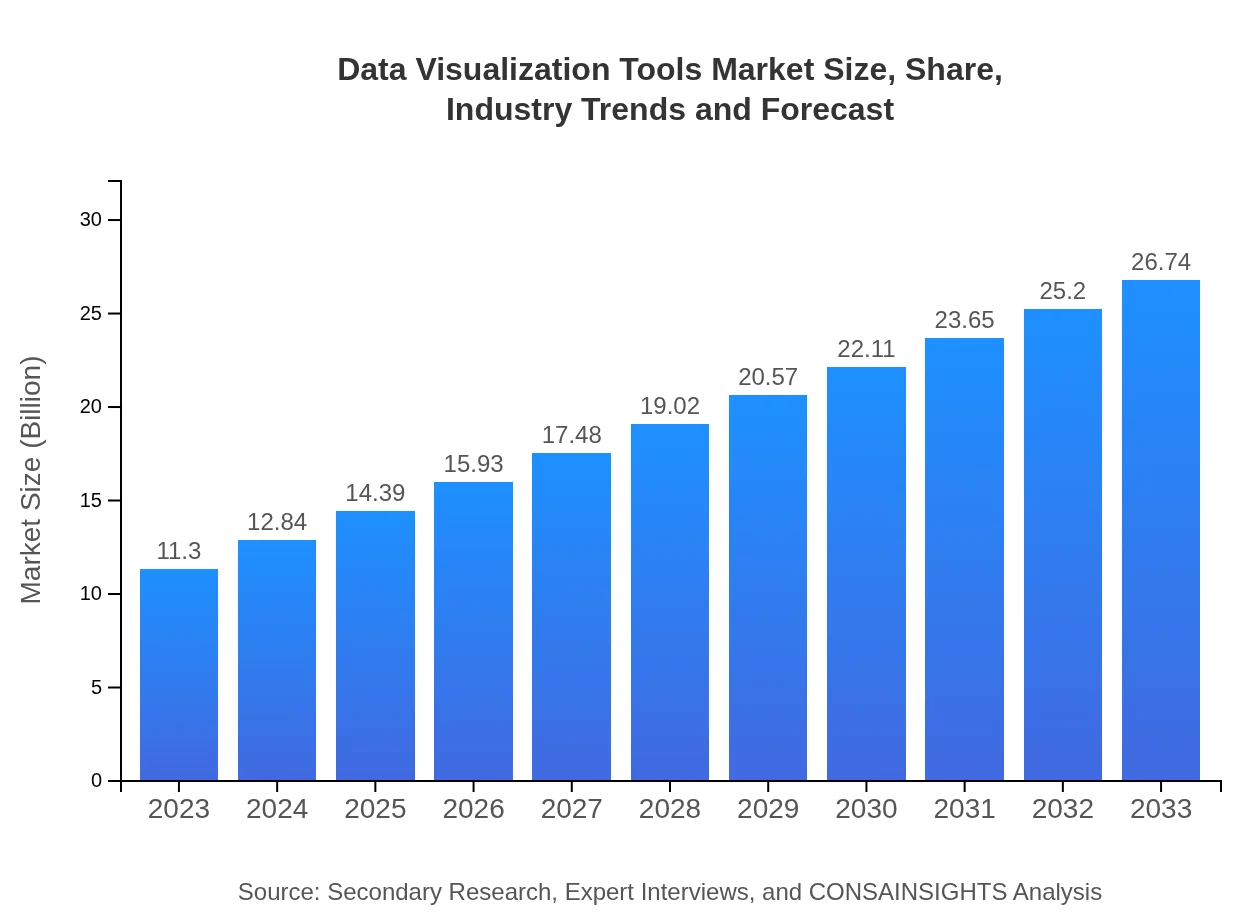
Data Visualization Tools Market — USD 11.3 billion in 2023, Growing to USD 26.74B by 2033 at 8.7% CAGR
This report provides an in-depth analysis of the Data Visualization Tools market from 2023 to 2033. It covers market trends, regional insights, industry analysis, segmentation, and the forecasted market size, offering valuable insights into the sector’s growth trajectory and key players.
| Metric | Value |
|---|---|
| Study Period | 2023 - 2033 |
| 2023 Market Size | $11.30 Billion |
| CAGR (2023-2033) | 8.7% |
| 2033 Market Size | $26.74 Billion |
| Top Companies | Tableau Software, Microsoft Power BI, Qlik, Looker (Google Cloud), Domo |
| Published Date | 23 September 2024 |
| Last Modified Date | 31 January 2026 |
Data Visualization Tools Market Overview
Customize Data Visualization Tools Market Report market research report
- ✔ Get in-depth analysis of Data Visualization Tools market size, growth, and forecasts.
- ✔ Understand Data Visualization Tools's regional dynamics and industry-specific trends.
- ✔ Identify potential applications, end-user demand, and growth segments in Data Visualization Tools
What is the Market Size & CAGR of Data Visualization Tools market in 2023?
Data Visualization Tools Industry Analysis
Data Visualization Tools Market Segmentation and Scope
Tell us your focus area and get a customized research report.
Data Visualization Tools Market Analysis Report by Region
Europe Data Visualization Tools Market Report:
The European market is expected to rise from USD 3.81 billion in 2023 to USD 9.01 billion by 2033. The adoption of GDPR regulations is pushing organizations to utilize data visualization tools for compliance and insights.Asia Pacific Data Visualization Tools Market Report:
In the Asia Pacific region, the Data Visualization Tools market is anticipated to grow from USD 1.98 billion in 2023 to USD 4.69 billion by 2033, representing an increase in demand for analytics solutions fueled by digital marketing strategies and government initiatives promoting data literacy.North America Data Visualization Tools Market Report:
North America leads the global market with a projected increase from USD 4.10 billion in 2023 to USD 9.69 billion in 2033. Factors contributing to this growth include high technology adoption rates and substantial investments in data analytics initiatives.South America Data Visualization Tools Market Report:
The South American market for Data Visualization Tools is projected to expand from USD 0.43 billion in 2023 to USD 1.01 billion in 2033. The growth is being driven by increased adoption of data analytics in sectors like retail and finance.Middle East & Africa Data Visualization Tools Market Report:
In the Middle East and Africa, the market is expected to grow from USD 0.99 billion in 2023 to USD 2.34 billion by 2033, as industries like oil & gas and finance increasingly leverage data visualization for operational insights.Tell us your focus area and get a customized research report.
Data Visualization Tools Market Analysis By Product

The Data Visualization Tools segment showcases robust growth in both software and hardware components. As of 2023, the market size for software is USD 9.13 billion, which is expected to rise to USD 21.61 billion by 2033, capturing 80.79% of the market share, reflecting its dominance over hardware solutions. Hardware, though smaller in market share, also shows potential, growing from USD 2.17 billion in 2023 to USD 5.14 billion in 2033, achieving a 19.21% share.
Data Visualization Tools Market Analysis By Application
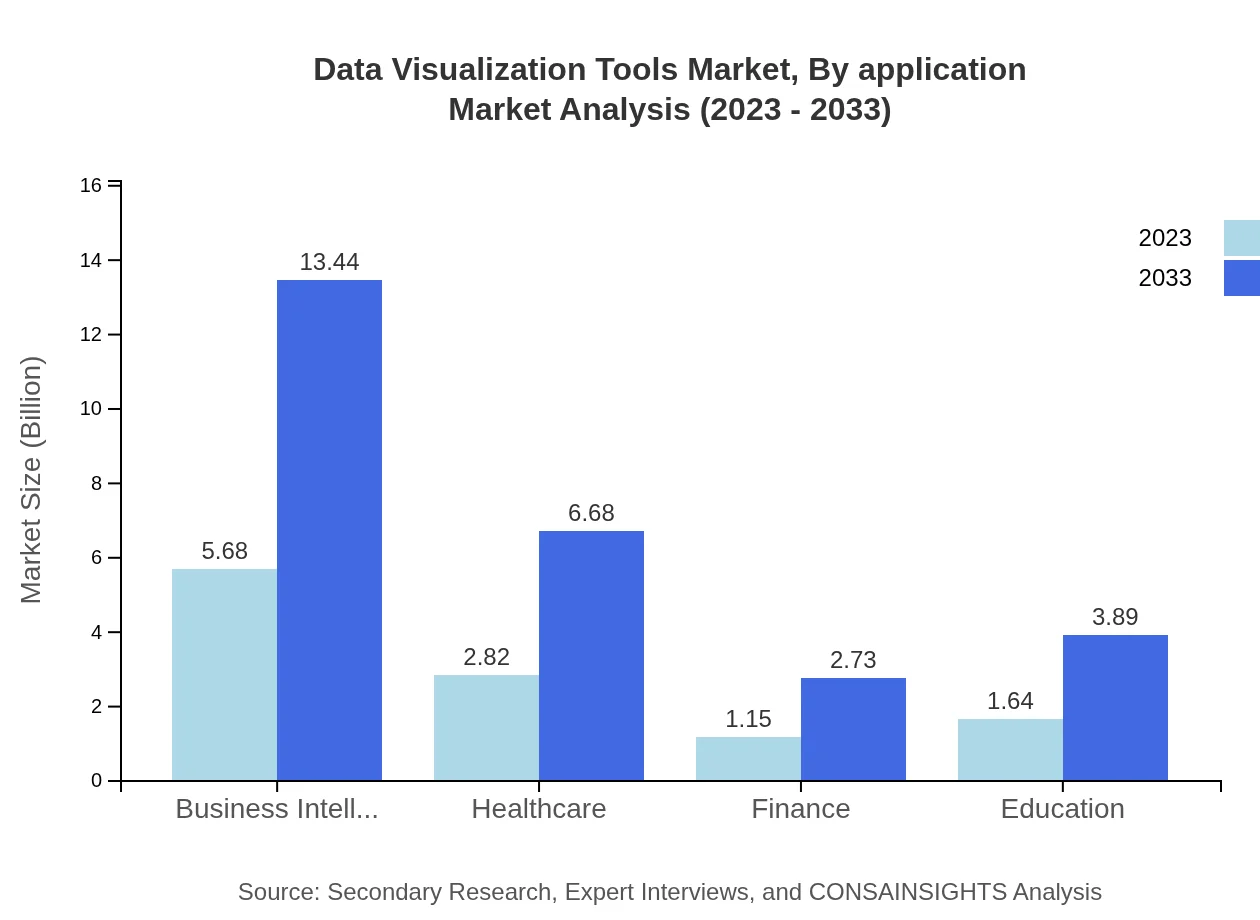
Applications of Data Visualization Tools span various industries with significant contributions from sectors such as IT and Telecom (USD 5.68 billion in 2023, expected to reach USD 13.44 billion by 2033), and Manufacturing (USD 2.82 billion rising to USD 6.68 billion). The healthcare sector is also notable, originating at USD 2.82 billion and anticipates expanding to USD 6.68 billion by 2033, underlined by a growing emphasis on patient data visualization.
Data Visualization Tools Market Analysis By Deployment Mode
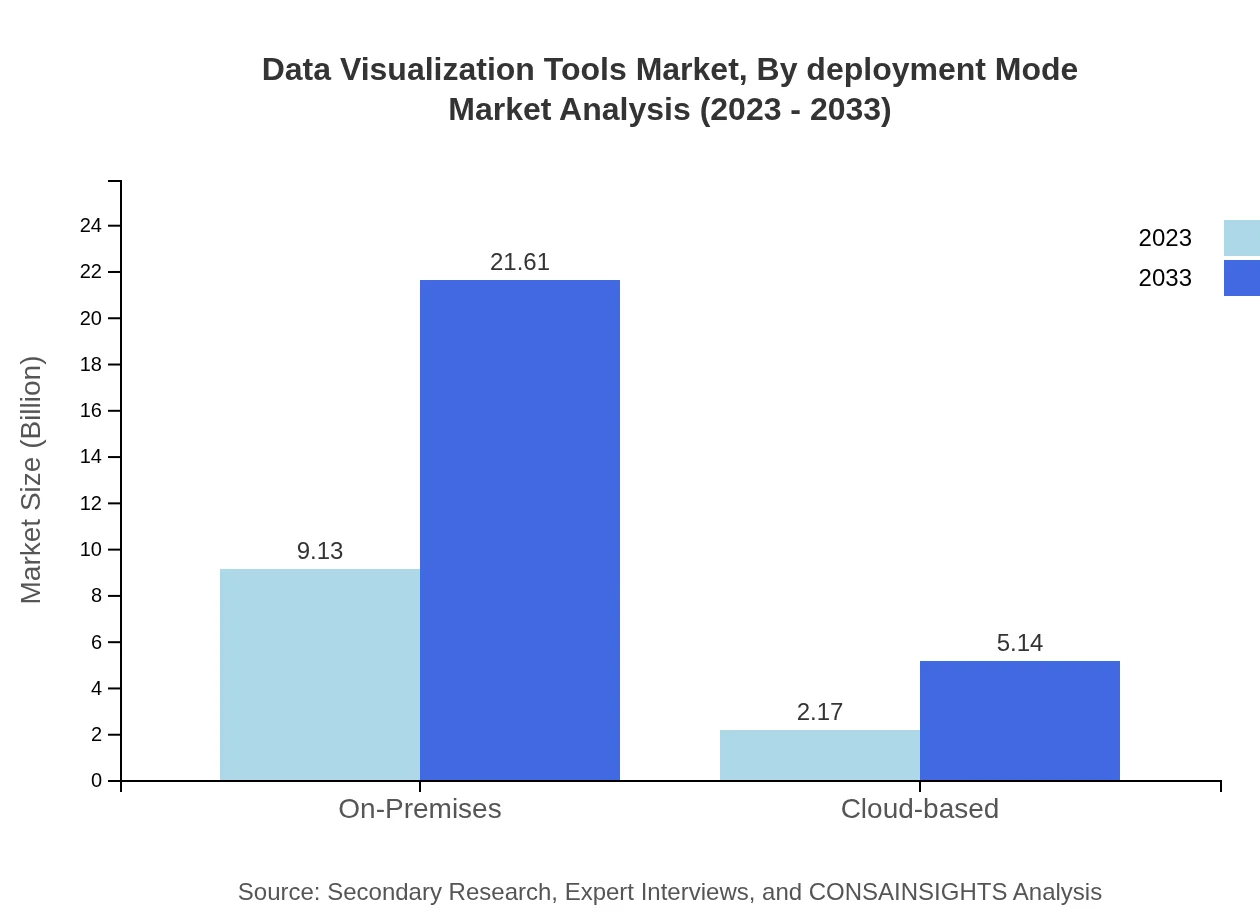
The deployment mode for Data Visualization Tools is primarily divided into On-Premises and Cloud-based solutions. On-Premises solutions are leading the sector, projected to surge from USD 9.13 billion in 2023 to USD 21.61 billion by 2033, maintaining an 80.79% market share. Cloud-based solutions, though smaller, are gaining traction, forecasted to rise from USD 2.17 billion to USD 5.14 billion, holding a 19.21% share as organizations seek scalable and flexible deployment options.
Data Visualization Tools Market Analysis By End User
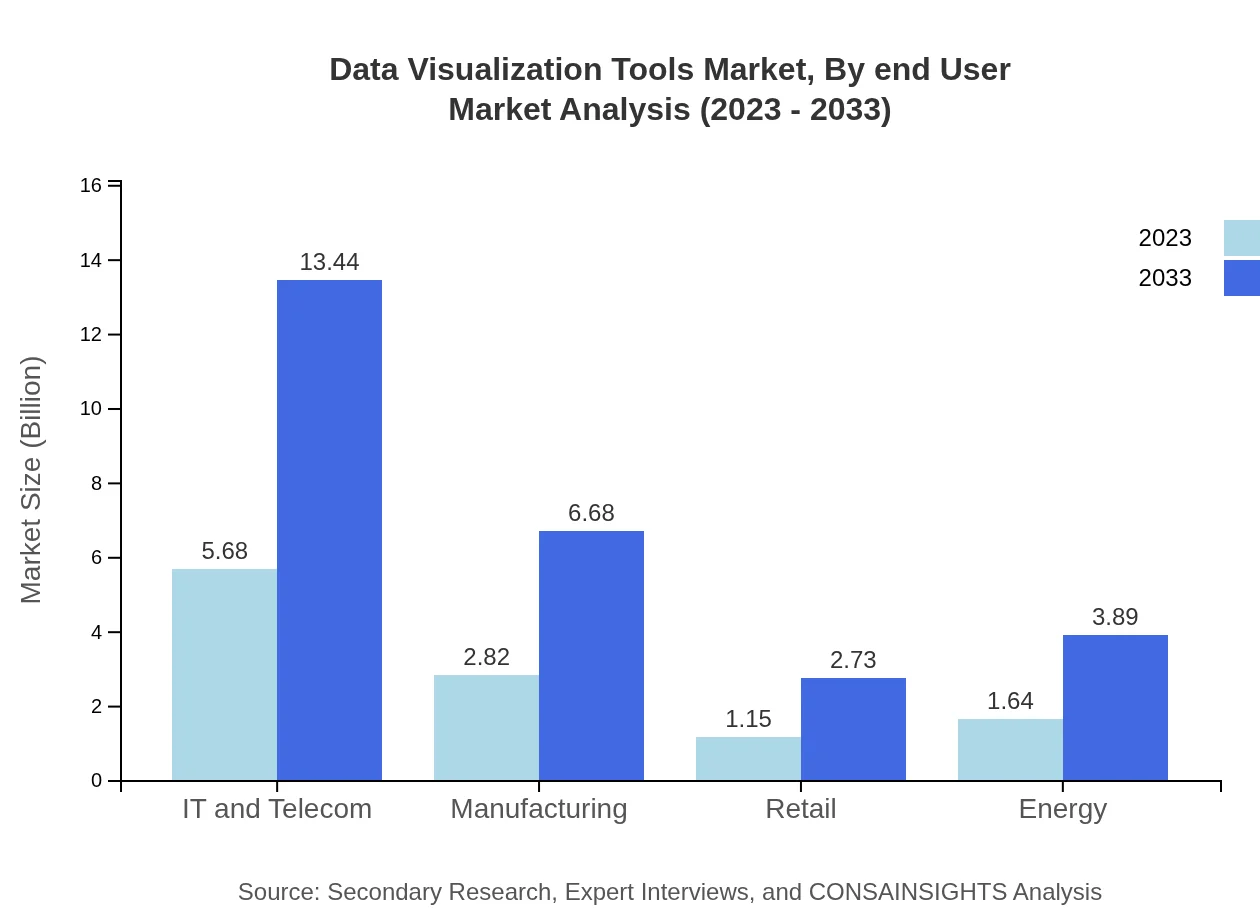
End-user industries such as Business Intelligence (50.27% share, USD 5.68 billion in 2023 rising to USD 13.44 billion) and healthcare show significant dependency on data visualization tools. The finance sector mirrors this growth, moving from USD 1.15 billion in 2023 to USD 2.73 billion by 2033, emphasizing the necessity for visualization in data-heavy environments.
Data Visualization Tools Market Trends and Future Forecast
Tell us your focus area and get a customized research report.
Global Market Leaders and Top Companies in Data Visualization Tools Industry
Tableau Software:
A market leader in business intelligence solutions, Tableau Software provides data visualization tools that empower users to create interactive and shareable dashboards.Microsoft Power BI:
Part of Microsoft's suite, Power BI offers robust analytics capabilities and seamless integration with existing Microsoft products, allowing for comprehensive data analysis.Qlik:
Qlik provides an end-to-end data management and analytics platform which includes visual analytics, enabling businesses to leverage big data effectively.Looker (Google Cloud):
Looker, now part of Google Cloud, offers a modern data platform that brings your data to life with robust visualization and analytics capabilities.Domo:
Domo is a cloud-based platform that transforms the way businesses manage and visualize their data, offering tailored dashboards for various industries.We're grateful to work with incredible clients.


FAQs
What is the market size of data Visualization Tools?
The global market size for data visualization tools in 2023 is estimated at $11.3 billion, with a projected CAGR of 8.7% from 2023 to 2033, indicating robust growth as organizations increasingly adopt these tools for better data insights.
What are the key market players or companies in the data Visualization Tools industry?
Key players in the data visualization tools market include Tableau Software, Microsoft Power BI, Qlik, Domo, and Looker. These companies dominate due to their innovative solutions and strong market presence, driving overall industry growth.
What are the primary factors driving the growth in the data Visualization Tools industry?
Primary factors driving growth include the increasing volume of data, the need for data-driven decision-making, advancements in big data technology, and rising demand for real-time analytics across various industries.
Which region is the fastest Growing in the data Visualization Tools?
The fastest-growing region for data visualization tools is Asia Pacific, with the market expected to grow from $1.98 billion in 2023 to $4.69 billion by 2033, reflecting an emerging demand for data analytics solutions.
Does ConsaInsights provide customized market report data for the data Visualization Tools industry?
Yes, ConsaInsights offers customized market report data tailored to specific requirements within the data visualization tools industry, allowing clients to gain deeper insights and strategic advantages.
What deliverables can I expect from this data Visualization Tools market research project?
From the market research project, you can expect detailed reports, market trend analysis, competitive landscape assessments, and actionable insights, helping guide your business strategies effectively.
What are the market trends of data Visualization Tools?
Current market trends include increased adoption of cloud-based solutions, expansion of AI and machine learning capabilities within tools, and a growing preference for mobile and real-time data visualization for enhanced user experiences.