Reports >
Technology And Media
>
Knowledge Graph

Knowledge Graph
First published: 15 January 2026 | Last updated: 31 January 2026 | Report Code: knowledge-graph
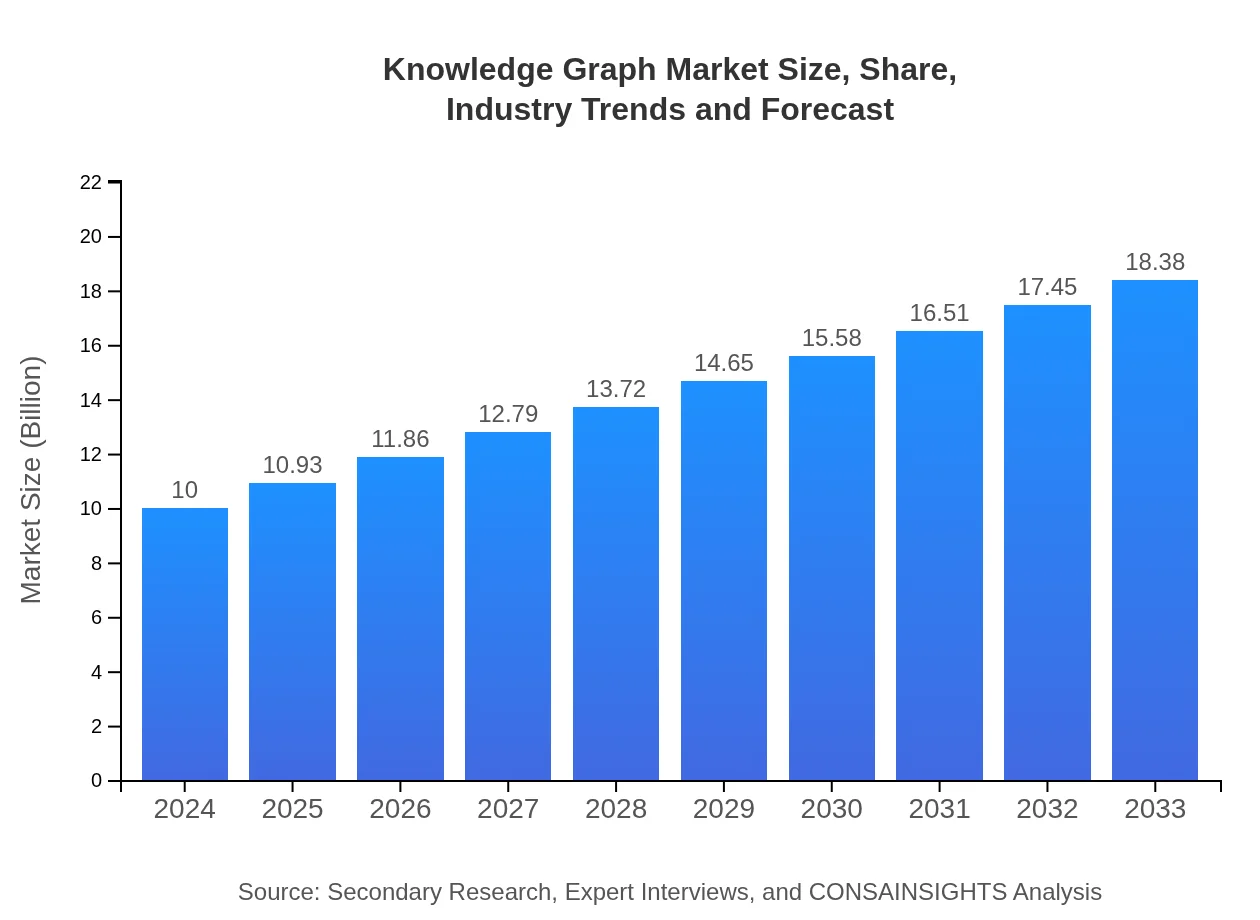
Knowledge Graph Market — USD $10 Billion in 2024, Growing to USD 18.38 by 2033 at 6.8% CAGR
This report offers a comprehensive analysis of the Knowledge Graph market, delving into current trends, sector segmentation, and regional insights from 2024 to 2033. It provides detailed data on market size, growth drivers, technological advancements, and challenges, offering valuable insights for businesses, investors, and policymakers seeking to understand this evolving landscape.
| Metric | Value |
|---|---|
| Study Period | 2024 - 2033 |
| 2024 Market Size | $10.00 Billion |
| CAGR (2024-2033) | 6.8% |
| 2033 Market Size | $18.38 Billion |
| Top Companies | Google, IBM, Microsoft |
| Published Date | 15 January 2026 |
| Last Modified Date | 31 January 2026 |
Knowledge Graph Market Overview
Customize Knowledge Graph market research report
- ✔ Get in-depth analysis of Knowledge Graph market size, growth, and forecasts.
- ✔ Understand Knowledge Graph's regional dynamics and industry-specific trends.
- ✔ Identify potential applications, end-user demand, and growth segments in Knowledge Graph
What is the Market Size & CAGR of Knowledge Graph market in 2024?
Knowledge Graph Industry Analysis
Knowledge Graph Market Segmentation and Scope
Tell us your focus area and get a customized research report.
Knowledge Graph Market Analysis Report by Region
Europe Knowledge Graph:
Europe is projected to experience significant growth, advancing from a market size of 3.61 in 2024 to 6.63 in 2033. Strong regulatory frameworks and a focus on data privacy fuel market expansion.Asia Pacific Knowledge Graph:
In the Asia Pacific region, the market is set to grow from a 2024 size of 1.87 to 3.43 by 2033. The region benefits from rapid technological adoption and strong government support for digital initiatives.North America Knowledge Graph:
North America shows robust performance with market size growing from 3.32 in 2024 to 6.10 in 2033. The region leads in innovation due to advanced R&D, high IT spending, and a mature tech ecosystem.South America Knowledge Graph:
South America, represented by Latin America data, is expected to expand from 0.99 in 2024 to 1.82 in 2033. Increasing investments in digital infrastructure and emerging tech startups are key growth drivers.Middle East & Africa Knowledge Graph:
The Middle East and Africa market is smaller but poised for growth, increasing from 0.21 in 2024 to 0.39 in 2033. Investment in digital transformation and mobile connectivity improvements are driving increased adoption.Tell us your focus area and get a customized research report.
Knowledge Graph Market Analysis Healthcare
Global Healthcare Market Analysis (2024 - 2033)
The healthcare segment grew from $4.32B in 2024 to $7.94B in 2033 while retaining a 43.2% share. Its integration of Knowledge Graphs enhances patient data management and clinical decision-making.
Knowledge Graph Market Analysis Finance
Global Finance Market Analysis (2024 - 2033)
The finance segment expanded from $2.15B in 2024 to $3.96B in 2033, maintaining a stable 21.53% share. It leverages Knowledge Graphs to improve risk management, fraud detection, and financial analysis.
Knowledge Graph Market Analysis Telecommunications
Global Telecommunications Market Analysis (2024 - 2033)
The telecommunications segment advanced from $1.11B in 2024 to $2.04B in 2033 with an 11.11% share. Knowledge Graphs enable enhanced network management and integrated customer data solutions.
Knowledge Graph Market Analysis E Commerce
Global E-commerce Market Analysis (2024 - 2033)
The e-commerce sector increased from $1.31B in 2024 to $2.41B in 2033, securing a 13.09% share. Enhanced product recommendations and personalized shopping experiences are driven by Knowledge Graph applications.
Knowledge Graph Market Analysis Media_entertainment
Global Media & Entertainment Market Analysis (2024 - 2033)
The Media & Entertainment segment grew from $1.11B in 2024 to $2.03B in 2033 with an 11.07% share. It utilizes Knowledge Graphs to boost content discovery and optimize audience targeting.
Knowledge Graph Market Analysis Data_integration
Global Data Integration Market Analysis (2024 - 2033)
Data integration displays robust growth from $6.09B in 2024 to $11.19B in 2033, boasting a 60.88% share. Knowledge Graphs streamline data consolidation, enabling richer analytics across diverse systems.
Knowledge Graph Market Analysis Search_and_discovery
Global Search and Discovery Market Analysis (2024 - 2033)
The Search and Discovery segment grew from $2.26B in 2024 to $4.15B in 2033 with a 22.61% share. It enhances search relevance and accelerates discovery processes across digital platforms.
Knowledge Graph Market Analysis Business_intelligence
Global Business Intelligence Market Analysis (2024 - 2033)
Business Intelligence expanded from $1.65B in 2024 to $3.03B in 2033, maintaining a 16.51% share. Knowledge Graphs empower data visualization and foster informed decision-making.
Knowledge Graph Market Analysis Semantic_web_technologies
Global Semantic Web Technologies Market Analysis (2024 - 2033)
Semantic Web Technologies advanced from $6.09B in 2024 to $11.19B in 2033 with a dominant 60.88% share. Knowledge Graphs drive advanced semantic linking and contextual data analysis.
Knowledge Graph Market Analysis Natural_language_processing
Global Natural Language Processing Market Analysis (2024 - 2033)
The Natural Language Processing segment increased from $2.26B in 2024 to $4.15B in 2033 while holding a 22.61% share. Knowledge Graphs enhance language understanding and data extraction.
Knowledge Graph Market Analysis Graph_database_technologies
Global Graph Database Technologies Market Analysis (2024 - 2033)
Graph Database Technologies expanded from $1.65B in 2024 to $3.03B in 2033, retaining a 16.51% share. Their advanced algorithms facilitate efficient data interlinking and query processing.
Knowledge Graph Market Analysis Enterprise_search
Global Enterprise Search Market Analysis (2024 - 2033)
Enterprise Search grew from $6.09B in 2024 to $11.19B in 2033, with a 60.88% share. Knowledge Graphs optimize internal data retrieval and elevate enterprise search capabilities.
Knowledge Graph Market Analysis Artificial_intelligence
Global Artificial Intelligence Market Analysis (2024 - 2033)
The Artificial Intelligence segment increased from $1.65B in 2024 to $3.03B in 2033 with a 16.51% share. Its integration with Knowledge Graphs improves model interpretability and decision support.
Knowledge Graph Market Trends and Future Forecast
Tell us your focus area and get a customized research report.
Global Market Leaders and Top Companies in Knowledge Graph Industry
Google:
A leader in data-driven innovation, Google integrates Knowledge Graphs to enhance search algorithms and contextual processing across its diverse product portfolio.IBM:
IBM pioneers enterprise AI and analytics solutions, leveraging Knowledge Graph technologies to transform data utilization and drive digital transformation for global clients.Microsoft:
Microsoft advances cloud and AI services by implementing cutting-edge Knowledge Graph solutions, ensuring enhanced data connectivity and improved operational efficiencies.We're grateful to work with incredible clients.


FAQs
How can the knowledge Graph report help align our marketing strategy with customer adoption trends?
The report indicates that the Knowledge Graph market is projected to reach $10 billion by 2033, with a CAGR of 6.8%. This information helps marketers tailor strategies that anticipate customer needs and adoption patterns.
What product features are in highest demand according to the knowledge Graph trends?
Demand for healthcare and data integration features is on the rise, expected to account for 43.2% and 60.88% market shares respectively by 2024. Targeting these features can ensure alignment with market needs.
Which regions offer the best market entry and expansion opportunities in the knowledge Graph industry?
North America and Europe show robust growth potential, with markets expected to grow from $3.32 billion to $6.10 billion and $3.61 billion to $6.63 billion from 2024 to 2033, respectively.
What emerging technologies and innovations are shaping the knowledge Graph market?
Emerging technologies such as Semantic Web Technologies and Natural Language Processing are gaining traction, slated to achieve 60.88% of market share by 2033. Staying informed on these trends is crucial for developing competitive products.
Does the knowledge Graph report include competitive landscape and market share analysis?
Yes, the report provides a comprehensive analysis of market shares across various segments. For instance, healthcare leads at 43.2%, while data integration also holds significant market presence.
How can executives use the knowledge Graph report to evaluate investment risks and ROI?
The report outlines projected market growth at a CAGR of 6.8%, enabling executives to assess potential returns against risks. Understanding regional variances aids in making informed investment decisions.
What is the market size of knowledge Graph?
The knowledge-graph market is currently valued at $10 billion, with a projected CAGR of 6.8% from 2024 to 2033, indicating substantial growth opportunities and market expansion.
Knowledge Graph Market Analysis Social_networking
Global Social Networking Market Analysis (2024 - 2033)
The Social Networking segment advanced from $2.26B in 2024 to $4.15B in 2033 while sustaining a 22.61% share. Knowledge Graphs bolster user connectivity and enrich content discovery.